Top Ten List for 2024

Last year was a very strong one for our top ten picks where all 10 proved correct, and our six recommended stocks were up an average of 96% with 3 of the 6 appreciating over 100%. While there is some risk in continuing to recommend them after such a strong surge last year, we believe they will perform well this year and already said (in the previous post) that each would be on the new list. The price per share we’ll use is as of December 31, 2023, for each (including Tesla which is down about 25% YTD). We are going to add one new stock to the group, Nvidia, which is a strong play on the push to AI as its chips are well ahead of others for that space.

The first 6 declined substantially in 2022 despite solid performance as they were victims of interest rates surging. The Fed has indicated that rates will likely decline in each of the next few years which should, in turn, help our “long-duration” stocks appreciate. The risk to this assumption is if inflation reverses its downward trend and surges once again. That could mean the Fed not only reverses its projection of declining rates but might increase rates once again. This would be quite negative for our stocks as there is a built-in assumption in the market that this will not occur.

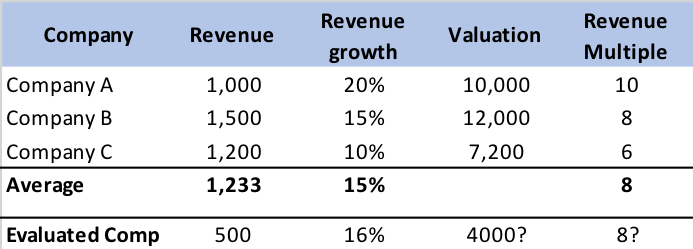
Even with the 96% average gain in 2023, in the past 2 years the average of the 6 (we’ll talk about Nvidia separately) is still down 18.6% despite average revenue expanding by 86% in the same period. What this means is the price/share to revenue has declined by 56% in the past 2 years. If we looked at this over 3 years the decline would be even steeper. So, even if one believes that these stocks were at an inflated price at the end of 2021, they do not appear to be inflated now. Given that they are all growth companies (with analyst estimates showing 5 of these 6 growing 20% or more in 2024 and the 6th, Amazon, growing over 11%) it appears to us there is still strong upside barring extraneous events that cause difficult market conditions.

Of course, there is another issue for bears to jump on – the potential for a recession. This could undermine company performance. It appears we are headed for a “soft landing” but that still is not a given, especially if rates don’t start coming down at some point in 2024.

I’ve often pointed out that I am not a great forecaster of economics or of the market as a whole so the above discussion may not mean inflation moderates further, or that Fed Rates decline, etc. Given the compression in revenue multiples across the board in tech stocks over the past three years (the three year decline was even greater than shown in our above two year table), the opportunity for investing still appears timely to me despite last year’s appreciation in the stocks.

2023 Stock Recommendations (Note: base prices are as of December 31, 2023)

1. Tesla will continue to outperform the market (it closed at $248.48/share)

While Tesla did appreciate over 100% in 2023, its stock still was nearly 30% lower than on December 31, 2021. This occurred even though revenue was up almost 70% in the same two-year period. And the stock is down over 25% YTD in 2024. While the company reached its target  of over 1.8 million vehicles sold in 2023, it came at a cost of much lower gross margins leading to a very low growth rate for revenue in Q4 and disappointing earnings.

This plus several other issues have weighed on the stock:

  1. The Cybertruck, which has a massive backlog, is expensive to manufacture and could have very low gross margins until it ramps up to volume which is not expected until late this year. In 2025 it should add a more substantial number of units to Tesla sales.
  2. Elon keeps causing concern amongst investors with his behavior.
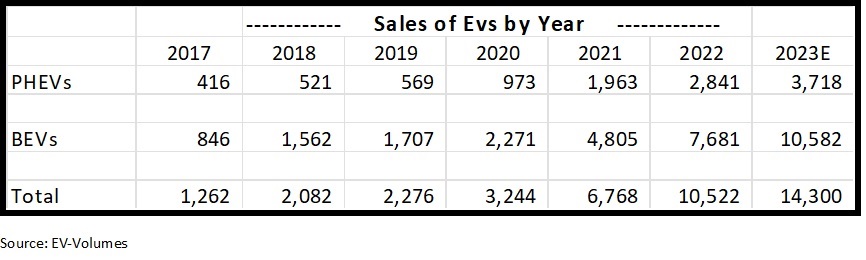
  3. The growth in sales of BEVs (Battery Electric Vehicles which does not include Hybrids) seems to be slowing. We always expect high growth rates to decline over time but still believe sales of BEVs will grow over 20% per year for some time. See our blog post for a full analysis of why we expect BEV sales to grow at a high rate for the next 5 years.
  4. The strategy of lowering prices to drive share gain is working in terms of market share gains but has had a negative impact on revenue growth and profitability.
  5. Competition is getting stronger.

While we agree that the Cybertruck will likely take much of 2024 to ramp up production it’s important to realize that sales of this vehicle are incremental for growth so selling 90,000 units would add 5% to Tesla’s 2024 unit growth rate (and more to its revenue growth rate), 180,000 would add 10%. We’re guessing shipments will likely be between the two with more than half in Q4. The vehicle is so unique that it should also act as a draw for people to visit Tesla showrooms which will help sales of other models.

If Elon is a bit distracted that should not impact Tesla as its product road map is pretty well set for the next 3-5 years. If his comments cause a subset of people to decide not to buy a Tesla this may be offset by others liking them and considering the vehicle.

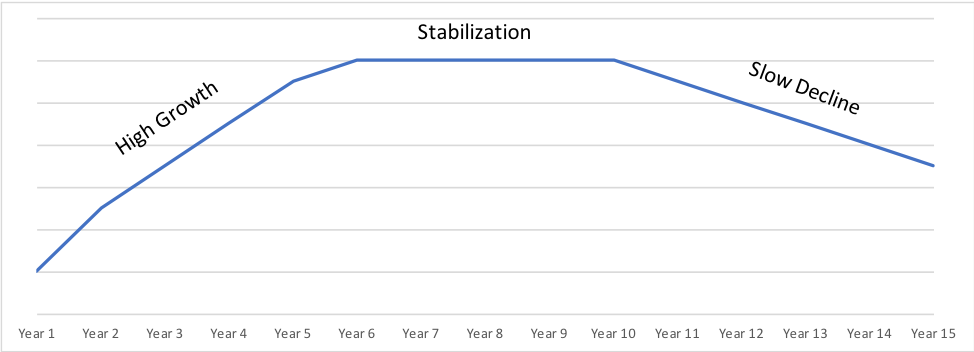
High growth rates almost always decline over time as a product scales. The growth in sales of BEVs cannot stay at the level it’s been at so it shouldn’t be a surprise that it is slowing. In 2022 BEV unit growth was about 60%, down from over 100% the year before. In 2023 it appears to be about 37%, still a very attractive rate. Because of high interest rates 2024 auto sales growth will moderate across all vehicle categories but we expect it to reaccelerate as rates decline.

The competition from Chinese manufacturers is getting stronger. But competition appears to be weakening from everyone else. In November General Motors announced a lowering of its sales and production goals. This month Ford announced a large reduction in investment in Electronic vehicles. In September Volkswagen cancelled its plans for a new factory for building BEVs. To us this means Tesla and one or two Chinese manufacturers are out executing traditional auto companies and gaining share. As more customers convert to BEVs we believe Tesla will continue to gain share of the overall market.

Analysts are predicting that Tesla will grow revenue by 15% -20% in 2024. We believe it could be higher given the introduction of the Cybertruck, expansion of sales of the Semi, and unit growth that we expect to be 25% or more. Revenue growth will be slowed by lower pricing vs the prior year in the first 2 quarters but helped by the ramp of the Cybertruck in the second half of the year. By Q3 Cybertruck sales will be more meaningful and the ASPs of other Tesla models vs Q3 2023 will be better. All in all, we expect Tesla to return to over 25% revenue growth by Q4 and potentially grow over 20% for the year as a whole. We believe this not only means that its stock will make up the ground it has lost YTD but could show solid appreciation over the close on December 31, 2023.

2. Shopify will outperform the market (it closed at $77.88 per share)

In our post of Top Ten predictions last year, we pointed out that the pandemic had created a major warping of Shop revenue growth.  Instead of the normal decline for high growth companies from its 47% level in 2019 it jumped to 86% growth in 2020 and still was above “normal” at 57% in 2021. Once physical retail normalized in 2022, Shopify growth plunged against the elevated comps declining to a nadir of 16% in Q2, 2022. When we included Shop in our Top Ten for 2023, we pointed out that we expected its revenue growth to return to 20% or more throughout 2023. This indeed did occur, and Shopify revenue growth was about 25% for the year. We expect the 20% – 30% growth rate to continue in 2024 as:

  1. Net revenue retention for the company continues to be over 100% due to Shopify successfully expanding the services it provides to its eCommerce business customers. Additionally, because successful eCommerce companies are growing, Shopify also grows its portion of the customer revenue it shares. 
  2. Shopify has emerged as the number one alternative to Amazon and larger companies are now being added to its customer base.

We believe Shopify remains an undervalued stock as its price to revenue is still 63% lower than at the end of 2021.  Additionally, the company is now at the point of leverage where earnings should grow faster than revenue.

3. CrowdStrike will outperform the market (it closed at $255.17 per share)

CrowdStrike (CRWD) has now rebranded itself as the “AI Native Security Platform”  given its leadership in using AI to prevent breaches. The company continues to gain a substantial share of the data security market. Given its leadership position in the newest technology coupled with what is still just over 3% of its TAM, CRWD remains poised for continued high growth. This coupled with over 120% net revenue retention for 20 straight quarters makes CrowdStrike a likely long-term grower at over 30% per year. High revenue retention is primarily driven by expanded module purchases where 63% of subscription customers now pay for 5 or more modules.

The recent threats by Russia to create a Cyber attack on the U.S. could be an additional boost to the entire security industry. CrowdStrike stands to be a disproportionate beneficiary as it has the most advanced technology for defending companies against such attacks.

4. Amazon will outperform the market (it closed at $151.75 per share)

As we forecast, Amazon improved revenue growth in each quarter of 2023 from its low point of 8.6% in Q4 2022. In Q3 2023 growth was back to 12.6%.  Additionally, the company increased its focus on profitability with Q3 profits up well over 200% versus the prior year’s weak numbers. This coupled with the improved environment for tech stocks helped drive Amazon’s share price to $151.75 at year end, up 81% from the close on December 31, 2022. We expect revenue growth to exceed 12% in 2024.

While continuing double digit revenue growth will help, a second potential driver is that new CEO Jassy seems to have decided to increase the focus on earnings growth. This is available to Amazon if it chooses to do so. If he continues that trend, it could be a catalyst to share appreciation. For example, Prime remains a distinct bargain as it not only includes free shipping but also a number of other benefits such as video streaming of movies and TV shows, some free eBooks, discounts at Whole Foods and more. Given that Prime has over 220 million members, a $20/year increase for the subscription or additional monetization of content in that amount per user (which equates to less than one extra movie or TV series purchased every 4 months) would add over $4.4 billion to revenue once it fully rolls out. Such an increase is worth about $8 per share of earnings. Additionally, the company has meaningful AI technology that could drive additional revenue. Amazon has also been trimming costs (as a percentage of revenue). Given this combination, we expect earnings to grow faster than revenue in 2024.

5. Data Dog will outperform the market (it closed at $121.65 per share)

Like many other high growth subscription-based software companies, Datadog experienced another solid year in 2023 with Q3 revenue growth at 26.7%. Also, like CrowdStrike, Datadog has a very high gross margin (GM) and is now at the point where it has started to leverage its GM driving up earnings (+96%) at a much faster rate than revenue. While the stock was up 66% in 2023, it is still down 32% over 2 years despite Q3 2023 revenue being 195% higher than Q3 2021.

6. The Trade desk (TTD) will outperform the market (it closed at $71.80 per share)

Every 4 years we point out that political spending in a Presidential election year adds an additional layer of revenue to the advertising space helping it have an above normal year of growth. In 2024 there are 3 additional factors that should help drive accelerated growth (discussed in prediction 9). CTV (Connected TV) has been gaining share of the space and The Trade Desk remains a leader in CTV. Analysts are forecasting 20% revenue growth for the company in 2024. We believe an increased market size coupled with share gains should help TTD grow revenue at an even greater rate. We believe such a result will lead to another year of solid stock performance.

7. Nvidia will outperform the market (it closed at 495.22 per share on December 31, 2023)

Nvidia is one of the strongest ways to invest in the coming AI evolution. Its generative AI-optimized GPUs have a technology lead on its competition and are needed by companies moving to AI. The demand for such a product currently exceeds supply, giving the company several quarters of backlog. Because of the shortage supply coupled with a superior product Nvidia has significant pricing power. 

In Q3 the company’s revenue grew over 200%. Because its gross margin was up to 75% the combination drove earnings of $4.02 for the quarter up nearly 7X from the prior year’s $0.58. Based on current earnings forecasts the stock is not expensive, trading at about 30X analyst earnings forecast for fiscal 2025 (year ending in January 2025).

Make no mistake, this will be a volatile stock given its startling growth. The question of whether current pricing can be maintained as stronger competition emerges could be an overhang. AMD launched a competitive product in December. It expects to ship as much as 400,000 GPUs in 2024. But, to put it in perspective relative to demand, Nvidia is forecasting shipping 1.5-2.0 million GPUs this year up from about 550,000 in 2023. This would mean AMD is projecting unit sales of about 25% of Nvidia units in 2024. It seems unlikely that AMD will try to force down pricing in 2024. Also, in general, the cost of manufacturing chips declines as a product matures so even if pricing declines 20%, gross margins could remain close to where they currently are. Intel is also working on becoming a leader in AI. It has several products and numerous customers but appears to be trailing Nvidia (and AMD) in technology.

A second potential issue for Nvidia is sales to China which comprised over 20% of its sales in Q3. The US government has restrictions on selling the most advanced technology to Chinese companies and Nvidia believes it has complied. The company also stated that it expects the percent of sales to China to decline in Q4.

For now, we believe Nvidia will continue its momentum throughout 2024 and beyond. Given that demand is growing rapidly (there are forecasts that 80% of all PC sales will be AI enabled in 4-5 years) pricing pressure that causes significant GM decline appears unlikely to emerge in the next 2-3 years. As we saw in the PC space (where Intel controlled things), as pricing on older chips declined, users tended to buy newer technology meaning that instead of paying less for the older product they paid what they had before for a more powerful product. It appears that the AI space is still young enough to replicate this trend.

8. Other “AI” Companies will emerge as strong performers.

Like the PC revolution in the 90s and the web from 2000 onward, AI appears to be a new generation for products that will lead to existing companies re-inventing themselves and new ones emerging. Each of the prior decades-long trends spawned numerous successes. It appears  that AI will be the next generational change in technology. It will dominate thoughts on Wall Street for the next decade or more with numerous winners emerging. While it’s hard for us to tell who else besides Nvidia, CrowdStrike and Tesla will distinguish itself as an AI leader and generate high revenue growth rates there are a number of candidates that are at the table.

In the chip world, AMD seems a strong candidate. Intel is trying to transform itself to another candidate but it has a large share of existing sales, so it needs to become a leader to generate enough new revenue to offset its loss of more traditional sales. IBM is inserting AI chips into its products which could mean a resurgence of demand for servers at higher pricing and margins. The same could be said for PC manufacturers.

While chips and hardware are the first stage of revenue generation from AI, hosting services from Microsoft, Amazon and others could be the next step in rolling out AI. They can potentially increase pricing and also grow their services. Social networks will also benefit but I’m not sure how someone like Meta can drive enough growth in monetization.

Security is already an important use of AI and CrowdStrike has utilized it to great effect. Others like SentenilOne are following in their footsteps. Gaming is another arena where AI will be important. And autos need to utilize it if autonomous self-driving cars are to become dominant. Tesla is at the forefront in creating such success with Waymo another very important player.

One of the most exciting arenas for AI is in robotics. Tesla is working on a robot that will heavily utilize AI to manage its movements, but a commercial product seems years away.

9. Furniture and Home accessories will stage a comeback in 2024, returning to growth.

Not surprisingly, home sales diminish when higher interest rates on mortgages increase the cost of ownership. And when this happens very quickly sellers are slow to reduce prices to reflect the inability of buyers to pay the same price as when rates were lower. The result last year was that US home sales hit a 30-year low. Additionally, homeowners taking out loans to remodel also stalled due to the higher rates. Sales of furniture and related accessories are highly correlated to home purchases and home remodels and were down 5-10% in 2023 vs 2022. Now that some time has passed where owners had difficulty selling their homes many are lowering prices making the cost of ownership more affordable. Also, The Fed is expected to stabilize and then reduce rates this year. This combination should lead to more home purchases and home remodels. Given the “easy comps” and built-up demand we expect furniture and related accessory sales to return to double digit growth during 2024 after a year of declining revenue.

10. Advertising revenue will have a comeback in 2024.

Advertising revenue was hurt last year by the economy as well as several short-term issues like the decline in furniture sales discussed in prediction 9. Many advertisers cut back spending due to issues with the economy. Stable interest rates should lead to increased spending by advertisers of goods and services.

Advertising also took a major hit from strikes in the auto industry and Hollywood. In each case this led to a loss of ad revenue. Without many new movies and shows media advertising was cut dramatically (no pun meant). And of course, GM, Stellantis (formally Fiat/Chrysler) and Ford cut their spending during the union strike.

Political spending on advertising mostly occurs in even years when the bulk of elections take place. Every fourth year this is boosted by the presidential primaries and election. Group M estimates that advertising spending (excluding about $1B spent on direct mail) will be about $16 billion dollars this year, up over 31% from the 2020 election year. While the bulk of the dollars will be spent on TV, online platforms like Facebook and Google will benefit as well. This also is likely to be the first presidential election where AI tools are used to improve targeting of potential campaign contributors.

The Warriors Revisited

It’s been a while since I posted, so I’m going to try to get 2 new ones out over the next 30 days. This one will be a return to my favorite sports team: The Warriors (or simply “Dubs”). It addresses several topics that have been heavily discussed in the media:

  • Should The Dubs trade Kuminga?
  • Have the The Dubs have abandoned their “2-track timeline (2TT)”?
  • Why did The Dubs trade Poole and others for Chris Paul?
  • What are the chances that The Dubs will win the title this upcoming season?

Should The Dubs trade Kuminga: Why Suggested Kuminga Trades Don’t Make Sense

A number of suggested trades that include Kuminga (and often Chris Paul) have been suggested in the media. We regard all the ones we’ve seen as substantially sub-optimal. First, any suggested trade that includes Paul would likely prevent the team from getting to their financial target (of under the luxury tax second apron) in the 24-25 season. If they don’t get under that apron, they will be heavily restricted in signing free agents and in what types of trades they can do.

Kuminga has progressed substantially. He was especially good in the final part of last season and should be better this year. He appears on the road to being a star in the NBA. Most of the suggested trades were for players who have been in the league a lot longer, are on larger contracts that were not about to expire (defeating the Dubs ability to get under the second apron penalty level in 2024-25), or for players that I believe Kuminga is already as good as or better then. Given that he is still early in his career we believe that he is likely to significantly improve from here. The fact that Kerr barely played him in last year’s playoffs is the reason trades are being suggested. The “experts” who are suggesting them are ignoring how good he was defensively and offensively in the second half of last season.  I think Kerr not using him in the playoffs was an error but motivated by the fact he is still very young, and Kerr wanted to add motivation for him to improve his rebounding.

All statistics from the Basketball Reference Guide

There are so many suggestions to trade Kuminga that it’s impossible to review them all. Instead, I’ll provide 2 typical examples to illustrate why they don’t make sense for the Warriors. One example is a proposed trade for Anunoby. Since Anunoby will make $12M more than Kuminga next season, the Warriors would also need to give up Moody and Payton (to match salaries). If they do that the cap rules would require signing minimum salary replacements who likely would be of lower quality than Moody and Payton, a major negative of such a trade. But even comparing Kuminga to Anunoby straight up is interesting. Since Anunoby played almost 36 minutes per game last year and Kuminga less than 21, the fairest comparison is to use stats per 36 minutes. Assuming they played the same amount of time each game, Kuminga would have averaged more points, rebounds and assists than Anunoby despite being 6 years younger and only in his second season (whereas Anunoby was in his 6th ). Since most young players improve dramatically between their 2nd and 6th seasons, Kuminga likely has significantly more upside than Anunoby. Kuminga also had a higher effective field goal average, trailed Anunoby slightly in 3-point % for the season but shot a much higher 49% from 3 in his last 19 games (and increased his rebounds and overall shooting as well). The one area where Anunoby is currently better is on defense (he was named to the NBA’s second team All-Defensive Team last season). But Kuminga, while not yet at an All-NBA level, became an outstanding defensive player in the latter part of last season. The statistics show that Kuminga is already a more efficient scorer, a better rebounder and better passer. Since Anunoby is ahead as a defensive player, they appear pretty equal already with Kuminga likely to surpass Anunoby this season or next.

A second example is a proposed trade for Thybulle. The suggestion includes the Warriors also giving up Cory Joseph and Tryce Jackson-Davis plus the teams swapping first round picks in 2029. The swap is so far out that it is hard to tell who would benefit so I think of it as the Warriors giving up Kuminga plus some extra for Thybulle. While Thybulle is a very strong defensive presence, that is a minor plus since Kuminga is already very strong defensively and should improve. On offense there is no comparison. Kuminga scores over 90% more points per 36 minutes, garners 30% more rebounds, generates over 75% more assists and maintains a higher shooting %. Combine this with a lower salary and how much better Kuminga was in the latter part of last season, this suggestion seems ludicrous as are most others that have been made by so-called “experts”.

I have used these examples as they typify how under-valued Kuminga is in speculated trades. That does not mean the Warriors would never trade him but at this point in time it seems to me to be extremely unlikely as he represents a high-quality player with unlimited potential at a low salary cost for the next 2 years. I view Moody as another potentially high-quality player (at a low cost) with strong upside but probably not quite as much upside potential as Kuminga. Unlike the beginning of last season, they both seem ready to emerge and become important cogs in a possible title run this year.

Have the The Dubs have abandoned their “2-track timeline (2TT)”: Two Track Timeline Very Much Alive!

Trading both Wiseman and Poole as well as several of last year’s rookie class has stirred a hornet’s nest of comments that the 2TT has been abandoned. We disagree and believe that it is still in play but modified to a more realistic timing for Track 2. Instead of thinking 8-10 years out, why not have:

Track 1 be the next 3 years (remainder of Curry contract).

Track 2 be the subsequent 3 years.

Let’s face it, even 6 years is a lifetime for the NBA as every one of the players below will have the opportunity to be a free agent within that period. And after 6 years all of them will have a second opportunity for free agency. So, trying to think beyond that is unrealistic as too many things can happen. With that in mind, here are the key players for track 2. Bear in mind this assumes everyone mentioned below will sign at least one new contract with the Warriors. Curry, Thompson, and Green will be 38, 36 and 36, respectively, at the start of the 2026-27 season. They are not included below but, of course, it’s somewhat likely that one or more of those 3 will still be a solid player that contributes to Track 2.

Track 2 – Potential Players from Current Roster (ages at beginning of 2026-27 season)

  1. Andrew Wiggins (31)
  2. Kevin Looney (30)
  3. Gary Payton II (33)
  4. Jonathan Kuminga (24)
  5. Moses Moody (24)
  6. Lester Quinones (25)
  7. Brandin Podziemski (23)
  8. Trayce Jackson-Davis (26)
  9. Gui Santos (24)
  10. Subsequent draft picks ?

Including Wiggins, Looney and Payton is quite realistic as they will all be in their peak years. In addition, the Dubs currently have 6 players that would be between 23 and 26 when we reach Track 2. Santos and Quinones are included because the high quality of their play in the G League indicates that they are currently better than last year’s rookies that were traded. But while both are under contract, neither is currently on the roster. Much has been made of the trades of Wiseman and Poole, but I believe that neither trade signifies abandoning the future as long as the Dubs keep Kuminga and Moody on the team. Wiseman was traded because he was a disappointment. Poole became a liability after signing a very rich 4-year contract a year ago (that would begin in the 2023-24 season) and then regressed significantly during last season.

In addition to improving the Track 1 team by trading Poole for Chris Paul (who is currently better), the Dubs also put themselves in a stronger position to acquire additional talent after the 2023-2024 season as they can get under the salary cap second apron in the 2024-25 season since Paul’s contract of $30M is not guaranteed for that year. The benefit of this is quite obvious when we consider the fact that the team might have kept DiVincenzo or signed a high-quality free agent if they had the flexibility that being under the second apron provides. Additionally, assuming several of the 6 players emerge as stars, the timetable for when they would need to be paid has a better spread than before since 4 of the 6 are rookies this year or next. The other 2, Moody and Kuminga, won’t be eligible for a contract extension until the 25-26 season giving the Warriors the opportunity for a cap reset in 24-25. When this is combined with the jump in cap expected in 2025 (due to a new TV contract) the Dubs can remain under the second apron in the 2025-26 season even if they need to substantially increase what they pay the two of them.

We are not suggesting that all 9 of these players will be on the team for Track 2 but rather that there is a strong potential available young core. While I firmly believe Kuminga and Moody can be stars this is not a given. If they fail to emerge then Track 2 may require the signing of a star free agent.

Why did The Dubs trade Poole and others for Chris Paul? We believe the Chris Paul for Poole trade was a positive for the Warriors this season.

One way to compare the offensive value of each player is to compare Poole (in the 21-22 championship season) to Chris Paul last year using “net points generated” shown in the table below. It adds together the point value of assists and steals to the player’s scoring average and then subtracts the lost opportunity from turnovers to establish one overall number. While this will certainly be far from exact, using Chris Paul’s averages from last season in the comparison seems the best approximation of what he might do this season. We used the numbers from Poole in the championship season so we have a basis of comparison of the current team to the one that year, but it should be noted that while Poole scored more last season than the year before, it was due to taking more shots since his field goal efficiency declined (to below the league average) and he also had less rebounds and more turnovers last year.

In this past season, 38.5% of Dubs-made field goals were 3- point shots. That means an average field goal was worth 2.385 points. They also made .371 foul shots for every field goal made. Assuming passes generate .371 made foul shots for every assist that would mean an assist would generate an average total of 2.385 + .371 (2.756)  points for the Warriors. The foul shots would come from passes where the recipient made the shot and was fouled plus those where the recipient missed the shot but was fouled. We believe the passer helped generate the foul shots in both cases and that there is a strong correlation between assists and passes that resulted in a missed assist because the recipient was fouled. We believe the points generated per assist are more valuable than unassisted field goals as it seems logical that an assist, on average would lead to a higher shooting percentage than unassisted shots and there would be more frequent times that no assist was recorded because the player was fouled.

*Poole stats for the 21-22 championship season  **Paul stats for 22-23 season.  Base Data from Basketball Reference guide   

In this past season the Warriors averaged 118.94 points per game and had about 105.6 possessions per game. This means they score 1.126 points per possession. If we assume a steal generates an average possession, then each steal would be worth 1.126 extra points to a team (we think it actually generates more than 1.126 points as many steals lead to uncontested shots – a higher number favors Paul). Using this value in points per steal provides the points from steals in the above table. Finally, every turnover takes away a possession from your team. So, using the same logic the above table subtracts the point value of those lost possessions. Summing the numbers shows that Chris Paul generated over 10 more points per game last year than Jordan Poole did in the championship year.

Paul shot a higher percentage from 3-point range and is a better defender than Poole. The main advantage Poole has over him is his explosive ability to get by defenders resulting in a higher 2-point field goal percentage. This analysis shows that Paul generates over 10 more points of offense than Poole per game. Even if that number turns out to be off by half when he joins the Warriors, the extra 5 points should mean a lot more wins! To me, it seems clear that the Dubs will be a better team with Paul this coming season. The risk to the trade is that Poole has a lot of talent and if he improves his defense and becomes more disciplined on offense, he could become a star in the future whereas Chris Paul is at the tail end of his career.

Can The Warriors make a Title run?

Let me start by saying this Warriors team appears better than the 21-22 title team. Comparing:

  1. Klay was finding his legs when he returned mid-season in 21-22 from a 2 ½ year absence.
  2. Kuminga and Moody were rookies, and they are both significantly better now.
  3. Gary Payton II was just emerging, and the team had to learn how to maximize his value.
  4. Kevin Looney is better now than he was in the Championship season and Kerr also is better at how to use him.
  5. Wiggins missed a major part of last season but is reaching the peak years of his career. He should be as good or better than the 21-22 season on both offense and defense.
  6. In the championship year, Jordan Poole was excellent on offense but was quite weak on defense and had a lot of turnovers.
  7. This season Chris Paul will replace Poole and will likely generate more points of offense due to his assists, steals, rebounds, and fewer turnovers. Despite his no longer being at his peak on defense he still should provide better defense than Poole.
  8. A key player in 21-22 was Otto Porter Jr. I believe Saric is as good.
  9. While other role players matter, they will get little court time in the playoffs, so if Curry and Green are as good this coming season as they were in the championship year then the Warriors will be much better. Last season Curry and Green were both better than the 2021-22 season. Curry scored more, had a higher 2-point and 3-point shooting percent, garnered more rebounds, and had roughly the same average number of assists per game. He also was a better defensive player than the year earlier. Last year, Green improved his scoring, had higher 2-point and 3-point shooting percentages and almost the same rebounds and assists per game while finishing 4th in the voting for Defensive player of the year.

Putting the above together leads me to believe the Warriors are better equipped to win the championship than in the 21-22 season. However, the competition is stronger this coming season than in the 21-22 season.

In the West:

  • Denver was missing Jamal Murray in 21-22 but had him back last year when they won.
  • Arizona now has Durant and Beale, 2 great players to go along with Booker and Ayton.
  • The Lakers added Gabe Vincent and Cam Reddish to a solid roster.

In the East:

  • The Celtics added Porzingis but gave up Smart – still probably makes them better.
  • The Bucks added Malik Beasley and Robin Lopez plus kept every one of their core 7 players.

Sacramento is a young team on the rise and could also contend. If the competition had not improved, I’d be picking the Warriors outright to win this year. Even with improved competition, I believe the Warriors can win this year (I didn’t think so last year) but they will need to be healthy come playoffs and playing their best ball.

Soundbytes

Just a quick reminder that I will be posting again within 30 days. The topic will be a deep dive into electric vehicles with mostly an emphasis on Tesla and some thoughts on Rivian and Lucid.

Top Ten List for 2023

2022 was one of the worst years in the past 50 for the stock market in general, and for my stocks in particular. There are multiple ways to look at it. On the one hand I’m mortified that stocks that I selected have declined precipitously not only impacting my personal investment portfolio but also those of you who have acted on my recommendations. On the other hand, I believe this creates a unique opportunity to invest in some great companies at prices I believe are extremely compelling.

What went wrong for my stock picks in 2022? I have always pointed out that I am not amongst the best at forecasting the market as a whole but have been very strong at selecting great companies which over the long term (5 years or more) typically have solid stock appreciation if their operating performance is consistently good. But even great company’s stock performance can be heavily impacted in any given year by market conditions. Two key drivers of negative market conditions in 2022 were the huge spike in inflation coupled by the Fed raising rates to battle it. Inflation peaked at 9.1% in 2022. To put this in perspective, in the 9 years from 2012 to 2020, inflation was between 0.12% and 2.44% with 6 of the years below 2.0%. It began to increase in 2021 (up to 4.7%) but many thought this was temporary due to easing of the pandemic. When the rate kept increasing in the first half of 2022 the Feds began to act aggressively. A primary weapon is increasing the Fed Rate which they did 7 times in 2022 with the total increase of 4.25% being the largest amount in 27 years.

When rates increase the market tends to decline and high growth stocks decline even faster. So, the big question in 2023 is whether the expected additional rate increases projected at just under 1% for the year (which theoretically is built into current share prices) is enough for The Fed. In November, inflation was down to 7.11% and decreased further in December to 6.45%. If inflation continues to ease, The Fed can keep rate hikes in line with or below their stated target and market conditions should improve.

Of course, there is another issue for bears to jump on – the potential for a recession. That is why the December labor report was comforting. Jobs growth remained solid but not overly strong growing at 247,000 for the prior three months. This was substantially lower then where it had been at the end of 2021 (637,000 in Q4). While jobs growth of this amount might lead to wage growth of substance, the growth in December was a fairly normal 0.3%. If this persists, the theory is that inflation will moderate further. Additionally, more and more companies are announcing layoffs, particularly in the Tech sector.

I pointed out above that I am not a great forecaster of economics or of the market as a whole so the above discussion may not mean inflation moderates further, or that Fed Rate hikes stay below a one percent total in 2023, or that we avoid a deep recession – all of which could be further negatives for the market. But given where stocks now sit, I expect strong upside performance from those I recommend below.

I also want to mention that given the deep decline in the market, 2022 was extremely busy for me and the decline in blogs produced has been one of the consequences. I’ll try to be better in 2023! I am going to publish the recap of 2022 picks after the new Top Ten blog is out. Suffice it to say the recap will be of a significant miss for the stocks portion of the forecast, but that means (at least to me) that there is now an opportunity to build a portfolio around great companies at opportune pricing (of course I also thought that a year ago).

Starting in mid-2021 the Tech sector has taken a beating as inflation, potential interest rate spikes, the Russian threat to the Ukraine (followed by an invasion), a Covid jump due to Omicron and supply chain issues all have contributed to fear, especially regarding high multiple stocks. What is interesting is that the company performance of those I like continues to be stellar, but their stocks are not reflecting that.

For 2023, the 6 stocks I’m recommending are Tesla(TSLA), Amazon (AMZN), CrowdStrike (CRWD), Shopify (SHOP), Data Dog (DDOG) and The Trade Desk (TTD). The latter two replace Zoom and DocuSign. While I have removed Zoom and DocuSign from this year’s list, I still expect them to appreciate but their growth rates are substantially below their replacements.

In the introduction to my picks last year, I pointed out that over time share appreciation tends to correlate to revenue growth. This clearly did not occur over in the last 12 months or the last 24 months as illustrated in Table 1.

Note: 2022 for CRWD is actually FY 23 estimated revenue as year end is Jan 31. 2022 revenue uses analyst consensus estimates for Q4 which has on average been lower than actual revenue. Averages are unweighted.

The average revenue gain in 2022 (FY 23 for CRWD) reported by these companies (using analyst estimates for Q4) was nearly 38% while the average stock in the group was down 58%. In 2021 all the stocks except CRWD were up but only Data Dog had higher appreciation than its revenue growth. But in 2022 Data Dog declined significantly despite over 60% revenue growth. If we look at the two-year combined record the average stock in this group had a revenue increase of over 116% with three of the six increasing revenues by over 150%! Yet, on average, share performance for the group was a decline of over 48%. It should also be noted that Amazon’s major profit driver, AWS grew much more quickly than the company as a whole. Another point to highlight is that the strength of the dollar meant that US dollar revenue growth was lower than actual growth on a neutral dollar basis.

While over time I would expect share performance to be highly correlated to revenue growth, clearly that has not been the case for the past 24 months. I look at the revenue multiple as a way of measuring the consistency of valuation. Of course, these multiples should be lower as a company’s growth rate declines but looking at these 6 companies the amount of the decline is well beyond anything usual. Certainly, the pandemic causing wild swings in growth rates is partly responsible in the case of Amazon and Shopify but the other 4 companies have continued to experience fairly usual growth declines for high growth companies and all remain at strong growth levels.

Table 2 shows the change in revenue multiples in 2021 and in 2022 and then shows the 2-year change as well. Over the 2-year period every one of these stocks experienced a multiple decline of at least 60% with three of them declining more than 80%. Even if one assumes that valuations were somewhat inflated at the beginning of 2021 it appears that they all have substantial upside from here especially given that they are all growth companies. Which means if the multiples stabilize at these levels the stocks would appreciate substantially in 2023. If the multiples returned to half of where they were on December 31, 2020, the appreciation would be pretty dramatic.

Notes: 1. CRWD numbers are for fiscal years 2022 and 2023 ending January 31. 2. For Q4 revenue for each company we used Analyst average estimates. 3. All averages are calculated on an unweighted basis.

Given the compression in revenue multiples across the board in tech stocks, the opportunity for investing appears timely to me. Of course, I cannot predict with certainty that the roughly 75% average decline in revenue multiple among these stocks represents the bottom but we never know where the bottom is.

2022 Stock Recommendations

(Note: as has been our method base prices are as of December 31, 2022)

1. Tesla will outperform the market (it closed 2022 at $123.18/share)

Despite revenue growth of over 50%, Tesla was one of the worst stocks in 2022. While Q4 financials have yet to be reported, the company car sales were announced as 405,278 in the quarter up over 31%. For the year, the company shipped over 1.3 million vehicles up 40% over 2021. These volumes are still without Tesla being in the biggest category of vehicles, pickup trucks. Revenue in Q4 is expected to be up more than units with an over 35% increase the analyst consensus (note: Tesla reported last night, and revenue was up 37%).

Earnings have been increasing faster than revenue and consensus earnings estimates for 2022 is over $4 (it came in at $4.07 up 80%), meaning the stock is now trading at about 30 X 2022 earnings. This is a very low level for a high growth company.

One concern for investors is the decrease in the Tesla backlog. At year end it was at about 44 days of production (or roughly ½ of units sold in Q4. While there are many elements to consider there is a concern that it will be difficult for Tesla to maintain an above 30% vehicle growth rate in 2023. But there are several factors that indicate that such a concern is potentially incorrect:

  • The US began again offering a $7500 tax credit for electric vehicles starting January 1, 2023. This clearly caused many to postpone their purchase to get the credit. Tesla attempted to offset this by offering a similar discount in the US late in 2022 but it is likely that demand was seriously impacted. In early 2023 Tesla lowered prices to insure more of its units qualified for the credit. While this price decrease lowers average AOV from Q4 it still left most of its units at or above prices one year ago as Tesla had raised prices multiple times in 2022.
  • The Tesla CyberTruck has a wait list that exceeds 1.5 million vehicles, which if added to the backlog, would increase it to a full year of vehicles. But, of course, the company needs to get this into production to address these orders. Currently the company is expected to begin production around the middle of this year and get to high volume some time in Q4.
  • Tesla has an easy comp in Q2 since China shut down for much of Q2 2022.
  • The company now has the manufacturing capacity to increase volumes – the question will be parts supply and whether demand will be strong if the economy goes into a recession.

Since manufacturing capacity increased by the end of Q3, Q4 showed another strong sequential increase in units sold of nearly 18%. Once again demand was not an issue for the company as its order backlog, while lower than at its peak, remained at 6 weeks exiting the quarter. This does not include the estimated 1.5 million units in backlog for the Tesla CyberTruck which would put the total backlog at over one year of current production capacity. The current estimate for this vehicle going into production is roughly mid-year 2023.

Tesla has increased manufacturing capacity with Fremont and China at their highest levels ever exiting Q3, and Berlin and Texas in the early ramp up stage. Despite a reduction of its backlog, demand for its vehicles continues to increase. As you hear of new competition in the electric vehicle market keep in mind that Tesla share of the US market for all cars is still only about 3% and in China and Europe it remains under 2%. As the world transitions to electric vehicles, we expect Tesla’s share of all auto sales to rise substantially, even as it declines in total dominance of the electric vehicle market. It deserves re-emphasis: when the Cybertruck begins shipping, Tesla total backlog could exceed one year of units even assuming higher production. And the Cybertruck current backlog isn’t expected to be fulfilled until late 2027!

As we forecast in prior letters, Tesla gross margins have been rising and in Q3 remained the highest in the industry. While lower vehicle prices and increasing cost of parts will place some pressure on gross margins, we still believe they will continue to remain by far the highest of any auto manufacturer:

  • Tesla, like Apple did for phones, is increasing the high margin software and subscription components of sales;
  • The full impact of price increases was not yet in the numbers last year, so its price reductions have less impact than their percent of AOV and add-on sales are likely to offset a portion of the decreases;
  • As its new factories ramp, they will increase their efficiency; and
  • Tesla will have lower shipping cost to European buyers as the new Berlin factory reaches volume production.

In Q4, we believe the Tesla Semi was produced in very small volumes and limited production capacity will mean any deliveries will remain minimal during the next few quarters. However, given its superior cost per mile the Semi is likely to become a major factor in the industry. Despite its price starting at $150,000 its cost per mile should be lower than diesel semis. Given potential of up to $40,000 in US government incentives the competitive advantage over diesels will be even greater. The company is expecting to increase production to about 50,000 per year by some time in 2024 (which would represent potential incremental annual sales in the 8-10 billion range). While this is ambitious, the demand could well be there as it represents a single digit percent of the worldwide market for a product that should have the lowest cost/mile of any in the semi category.

The new version of the roadster is being developed but it’s unclear when it will be ready. Nevertheless, it will become another source of incremental demand at high margins. What this all points to is high revenue growth continuing, strong gross margins in 2023 and beyond, and earnings escalation likely faster than revenue growth. While revenue growth is gated by supply constraints it should still be quite strong. The high backlog helps assure that 2023, 2024 and 2025 will be high growth years. While the company has reduced pricing recently, the ability to sell greater dollars in software should help maintain strong AOV and gross margins

2. Crowdstrike (Crwd) will outperform the market (it closed 2022 at $105.29/share)

The most recently reported quarter for CrowdStrike, Q3 FY23 was another strong one as the pandemic had little impact on its results. Revenue was up 53% and earnings 135%. Existing customers continued to expand use of the company’s products driving Net Revenue Retention to exceed 120% for the 16th consecutive quarter. CrowdStrike now has over 59% of customers using 5 or more of its modules and 20% using at least 7 of its modules. Of course, the more modules’ customers use the bigger the moat that inhibits customer defection.

Older data security technology was focused primarily on protecting on-premises locations. CrowdStrike has replaced antivirus software that consumes significant computing power with a less resource-intensive and more effective “agent” technology. CrowdStrike’s innovation is combining on premise cybersecurity measures with protecting applications in the cloud. Since customers have a cloud presence, the company is able to leverage its network of customers to address new security issues in real time, days faster than was possible with older technology. While the company now has nearly 20 thousand subscription customers it is still relatively early in moving the market to its next gen technology. Given its leadership position in the newest technology coupled with what is still a modest share of its TAM the company remains poised for high growth.

High revenue growth coupled with 79% subscription gross margins, should mean earnings growth is likely to continue to exceed revenue growth for some time. In Q3 earnings grew 135%. While its stock is being penalized along with the rest of the tech market (its multiple of revenue declined by over 66% in 2022 and 80% in the past 2 years), its operational success seems likely to continue. Once pressures on the market ease, we believe CrowdStrike stock could be a substantial beneficiary.

3. Amazon will outperform the market (it closed 2022 at $84.00/share)

Amazon improved revenue growth in Q3 to 15% from 7% in Q2. In constant currency (taking out the impact of the increased strength of the dollar) its growth was 19% versus 10% in Q2. However, the company guidance for Q4 unnerved investors as it guided to Q4 revenue growth of 2-8% year/year and 4.6% higher in constant currency. Because AWS, which grew 27% y/y in Q3 is a smaller part of revenue in Q4 than other parts of the year, the weaker consumer growth can tend to mute overall growth in Q4. As the company heads into 2023 it should benefit from weaker comps and we expect revenue growth to improve from Q4. Of course, the Fed pushing up interest rates is likely to slow the economy and Analysts are currently predicting revenue growth of about 10% in 2023 (which would be higher in constant currency). But it’s important to understand that the profit driver for the company is AWS which generates nearly all the profits for the company. Even in a weaker economy we would expect AWS revenue to grow over 20%.

While Amazon is not the “rocket ship” that other recommendations offer, its revenue multiple has slipped by over 60% in the past 2 years. We believe improved growth coupled with smaller Fed increases should benefit the stock. One important side point is that the fluctuation in Rivian stock impacts Amazon earnings and Rivian was down quite a bit in Q4.

One wild card for the stock is whether its recent 20 for 1 stock split will lead to its being included in the Dow Jones Index. Because the index is weighted based on stock price Amazon could not be included prior to the split as its weight (based on stock price) would have been around 30% of the index. Given its share price post-split it is now a good fit. The Dow Index tries to represent the broad economy so having the most important company in commerce included would seem logical. Changes in the composition of the index are infrequent, occurring about once every 2 years, so even if it gets included it is not predictable when that will occur. However, should it occur, it would create substantial incremental demand for the stock and likely drive up the price of Amazon shares.

4. The Trade Desk (TTD) will outperform the market (it closed 2022 at $44.83/share)

TTD provides a global technology platform for buyers of advertising. In the earlier days of the web, advertisers placed their ads on sites that had a large pool of users that met their demographic requirements. These sites were able to charge premium rates. TTD and others changed this by enabling an advertiser to directly buy the demographic they desired across a number of sites. This led to lower rates for advertisers and better targeting. Now with the rise of Connected TV TTD applies the same method to video. By moving in this direction advertisers can value and price data accurately. Given its strength of relationships, TTD has become the leader in this arena. The company believes that we are early in this wave and that it can maintain high growth for many years as advertisers shift to CTV from other platforms that have been more challenged due to government regulations regarding privacy as well as Apple changes for the iPhone.

In Q3 The Trade Desk grew revenue 39% and earnings 44% as their share of the advertising market continued to increase. We believe TTD can continue to experience strong growth in Q4 and 2023. We also believe after having its revenue multiple contract 70% over the past 2 years the company can also gain back some of that multiple.

5. DataDog will outperform the market (it closed 2022 at $73.50/share)

Datadog is an observability service for cloud-scale applications, providing monitoring of servers, databases, tools, and services, through a SaaS-based data analytics platform. Despite growing revenue close to 60% and earnings about 100% its stock still declined about 59% in 2022 due to the rotation out of tech stocks driven by the large Fed Rate increases. The company remains in a strong position to continue to drive high revenue growth and even higher earnings growth going forward.

6. Shopify (Shop) will outperform the market (it closed at $34.71/share)

Shop, like Amazon, experienced elevated growth in 2020 and the first half of 2021. This was due to Covid keeping people out of stores (many of which weren’t even open) and resulted in revenue escalating 86% in 2020 from 47% in 2019. The rate tapered off to a still elevated 57% in 2021 with Q4 at 41%. The elevated comps resulted in a decline in growth to below normalized levels once consumers returned to Brick & Mortar stores. By Q2, 2022 year over year revenue growth had fallen to 16%. We expected growth to return to over 20% and potentially stabilize there. This occurred in Q3 as revenue growth improved to 22%. We believe Shopify can continue to achieve stable growth in the 20% range or higher in 2023 as long as the economy does not go into a deep recession. Shopify has established a clear leadership position as the enabler of eCommerce sites. Its market share is second to Amazon and well ahead of its closest competitors Walmart, eBay, and Apple. Net revenue retention for the company continues to be over 100% as Shopify has successfully expanded services it provides to its eCommerce business customers. Additionally, because successful eCommerce companies are growing, Shopify also grows its portion of the customer revenue it shares.

Because of the wild swing in growth due to Covid, Shop experienced the most extreme multiple compression of the 6 stocks we’re recommending, 79% last year and 84% over the past two years. This leaves room for the stock to appreciate far beyond its growth rate in 2023 if market conditions improve.

Non-Stock Specific Predictions

While I usually have a wide spectrum of other predictions, this time I wanted to focus on some pressing issues for my 3 predictions that are in addition to the fun one. These issues are Covid, inflation and California’s ongoing drought. They have been dominating many people’s thoughts for the past 3 years or more. The danger in this is that I am venturing out of my comfort zone with 2 of the 3. We’ll start with the fun prediction.

7. The Warriors will improve in the second half of the current season and make the Playoffs

I always like to include at least one fun pick. But unlike a year ago, when I correctly forecast that the Warriors would win the title, I find it hard to make the same pick this year. While I believe they can still win it, they are not as well positioned as they were a year ago. This is partly because a number of teams have gotten considerably better including Memphis, Denver, the Kings and New Orleans in the West (with the Thunder, an extremely young team appearing to be close) and the Celtics, Bucks, Nets and Cavaliers in the East. The Warriors, by giving up Otto Porter and Gary Payton II (GPII), and other experienced players, took a step backwards in the near term. I believe signing Divincenzo gives them a strong replacement for GPII. They will need Klay and Poole to play at their best and Kuminga to continue to progress if they are to have a stronger chance to repeat.

8. Desalination, the key to ending long term drought, will make progress in California

It’s hard to believe that California has not been a major builder of desalination plants given the past 7 years of inadequate rainfall. Despite the recent rainfall, which might bring reservoirs back to a normal state by summer, it appears to be a necessary part of any rational long-term plan. Instead, the state is spending the equivalent of over one desalination plant per mile to build a high-speed railway (HSR) ($200 million per mile and rising vs $80 million for a small and up to $250 million for a very large desalination plant). When voters originally agreed to help fund the HSR the cost was projected at $34 billion dollars. According to the Hoover Institute, the cost has grown to over triple that and is still rapidly rising. If I had my druthers, I would divert at least some of these funds to build multiple desalination plants so we can put the water crisis behind us. Not sure of how many are needed but it seems like 10 miles of track funding 10 larger plants would go a long way towards solving the problem. It is interesting that Israel has built plants and has an abundance of water despite being a desert.

9. Inflation will continue to moderate in 2023

The Fed began raising rates to combat inflation early in 2022, but it didn’t peak until June when it reached 9.1%. One trick in better understanding inflation is that the year over year number is actually the accumulation of sequential increases for the past 12 months. What this means is that it takes time for inflation to moderate even when prices have become relatively stable. Because the sequential inflation rates in the second half of the year have been much lower than in the first half, inflation should keep moderating. As can be seen from Table 3, the full year’s increase in 2022 was 6.26% (which is slightly off from the announced rate as I’ve used rounded sequential numbers). The magnitude of the increase was primarily due to the 5.31% increase from January 1 through June 30.

If the second half of the year had replicated this, we would be at over 11% for the year. However, the Fed actions have taken hold and in the second half of the year (July 1 – December 31) inflation was down to 0.90% or an annualized rate of under 2.0%. And between November 1 and December 31 we had complete flattening of sequential cost. What this indicates to me is that the likelihood of inflation moderating through June 30, 2023 is extremely high (no pun meant). If I were to guess where we would be in June, I’d speculate that the year/year increase will be between 1% and 3%.

10. Covid’s Impact on society in the US will be close to zero by the end of 2023

Covid has reached the point where most (roughly 70%) of Americans are vaccinated and we estimate that over 75% of those that aren’t have already been infected at some point and therefore have some natural immunity. This means about 92% of Americans now have some degree of protection against the virus. Of course, given the ongoing mutation to new forms of Covid (most recently to the Omicron version) these sources of immunity do not completely protect people and many who have been vaccinated eventually get infected and many who already had Covid got reinfected. However, if we study peak periods of infection there appears to be steady moderation of the number of infections.

Covid infections reached their highest peak in the US around January 2022 at a weekly rate of approximately 5 million new cases. It subsequently dropped steadily through May before rising to another peak, fueled by Omicron, in July 2022 at a weekly rate of about 1 million (an 80% peak to peak decrease). Again, it subsequently dropped until rising more recently to a post-holiday/winter peak in early January 2023 to a weekly count of under 500,000 (a peak-to-peak drop of over 50% from July).

While the progress of the disease is hard to forecast the combination of a more highly vaccinated population coupled with a high proportion of unvaccinated people now having some immunity from having contracted the disease seems to be leading to steady lowering of infection rates.

More importantly, death rates have declined even faster as lower infection rates have been coupled with milder cases and better treatments (due to vaccinations and natural immunity increases for the 50% of the population that have contracted the disease over the past 3 years). Despite the recent post-holiday spike, deaths from Covid were under 4,000 across the country (or about 0.001% of the population) in the most recent week reported. If the seasonal pattern follows last year, this will be a peak period. So, using this as being very close to the likely maximum rate per week, we can forecast that the annual death rate from Covid in 2023 will be between 100,000 and 200,000 Americans. This would put it between the 4th and 6th leading causes of death for the year with heart disease and Cancer the leading causes at over 600,000 each.

Given that most people have already significantly reduced use of masks and are visiting restaurants, department stores, theaters, sporting events, concerts and numerous other venues where people are quite close to each other, we believe the impact of Covid on the economy has faded and that 2023 will be a relatively normal year for consumers. Of course, the one wild card, which I believe has a low probability of occurring, is that a new variant causes a surprising massive spike in deaths.

Top Ten List for 2022

The past year has been extremely busy for me and the decline in blogs produced has been one of the consequences. On the one hand, I’m mortified that my annual Top Ten list has been delayed by 2 months. On the other hand, it turns out that the steep decline in tech valuations affords an opportunity for acquiring recommended stocks at much lower cost than they were on January 2. Because I don’t want to delay recommendations further, I am going to publish the recap of 2021 picks after the new Top Ten blog is out. Suffice it to say the recap will be of a down year after posting my best year ever in 2020, but that means (at least to me) that there is now an opportunity to build a portfolio around great companies at opportune pricing.

Starting in November of 2021 the Tech sector has taken a beating as inflation, potential interest rate spikes, the Russian threat to the Ukraine (followed by an invasion), a Covid jump due to Omicron and supply chain issues all have contributed to fear, especially regarding high multiple stocks. What is interesting is that the company performance of those I like continues to be stellar, but their stocks are not reflecting that. For 2022, the 6 stocks I’m recommending are Tesla, DocuSign, Amazon, Zoom, CrowdStrike and Shopify (the only new one on my list).

In the introduction to my picks last year, I pointed out that over time share appreciation tends to correlate to revenue growth. This clearly did not occur over the last 14 months as illustrated in Table 1.

The average revenue gain in the last quarter reported by these companies was 43%, while the average stock in the group was down 17%. It should also be noted that Amazon reported that its major profit driver, AWS, had grown 40% while eCommerce had been relatively flat year over year and the stock reacted positively due to the AWS increase. Over time I expect share performance to be highly correlated to revenue growth, but clearly that has not been the case for the past 14 months. Shopify, Zoom, DocuSign and Amazon had revenue growth largely distorted by Covid, with 2020 growth being well above their norm and 2021 growth coming down dramatically. This caused their stocks to plummet as the interpretation of 2021 results was that long term growth had slowed. Yet in all cases the 2-year compound growth rate was well above the previous norm.

Table 2 highlights this abnormality.

In Q3 2019, Zoom’s revenue growth was 85%. Such a high rate of growth usually declines each year barring some abnormal situation. Instead, the growth rate soared in 2020 and the jump was followed by additional growth in 2021. The 2-year CAGR was 151% and Zoom had over 6 times the revenue in Q3 2021 than it did 2 years earlier. Yet, its share price is now roughly only 10% above where it was 2 years ago and down 63% from January 1, 2021. While Zoom is the most extreme situation of the four companies in Table 2, each of the other three have had a similar whipsaw of its revenue growth rate and in each case its stock soared in 2020 only to heavily trail revenue growth in 2021 despite its 2-year CAGR being above pre-pandemic levels in every case. While revenue growth at Tesla and CrowdStrike were not impacted in a similar way by the pandemic as both had more normal revenue growth patterns in 2020 and 2021, they still saw share performance significantly trail revenue growth for the past year.

Given the compression in revenue multiples across the board in tech stocks, the opportunity for investing appears timely to me. Of course, I cannot predict that the roughly 59% average decline in revenue multiple among these stocks represents the bottom…as I never know where the bottom is.

2022 Stock Recommendations (Note: base prices are as of February 25, 2022)

  1. Tesla will continue to outperform the market (it closed at $810/share)

a. Tesla demand has far outstripped supply, as backlog increased steadily during 2021. And this is before the Cyber Truck with it’s over a million pre-orders, has come to market. This has been partly based on a substantial surge in demand and partly due to a shortage of some parts. While Tesla has made and will continue to drive up capacity by launching multiple new factories, supply of parts has prevented the factories from operating at capacity. Rather than overspending to secure more supply (a major error by Peloton), Tesla has chosen to raise prices and to prioritize production of more expensive (and more profitable) versions of its products. As of December 31, wait times for the standard Model 3, Model Y and Model S were approximately 10-11 months while the more expensive high-performance version of each had delivery times of 2-3 months. For the Model X, delivery dates were even longer. As we forecast in prior letters, Tesla gross margins have been rising and in its most recently announced fourth quarter were the highest in the industry. Yet, we believe they will still go up from here as:

  • Tesla, like Apple did for phones, is increasing the high margin software and subscription components of sales;
  • the full impact of recent price increases is not yet in the numbers;
  • its factories are not yet operating at full efficiency; and
  • Tesla will have lower shipping cost to European buyers once the Berlin factory begins to ramp.

b. Cyber Truck preorders are now estimated at over 1.25 million units (approximately $79 billion in sales value) according to a fan tracker site, or 50% more potential revenue than 2021 total revenue. Obviously, some of the orders will be cancelled given the long wait times before delivery, but still, this virtually assures large revenue increases for 2022 and 2023, only gated by obtaining enough supply of parts. The Cyber Truck is not expected to ship until mid-2022 and is not material to meeting revenue forecasts for this year. The Tesla Semi appears close to being ready to go into production, but battery constraints will probably mean any deliveries will be truly minimal for Q1 (Pepsi expects to take delivery of at least 15 in the near term). The Berlin factory, a key to increasing its share in Europe, will likely begin manufacturing in the first half of 2022. What this all points to is high revenue growth continuing, stronger  GMs in 2022, and earnings escalation likely faster than revenue growth. While revenue growth is gated by supply constraints it should still be quite strong. And the high backlog not only assures that 2023 will be another high growth year but also means there is little pressure on Tesla pricing.

  1. Shopify will outperform the market (it closed at $677 per share)

Shopify, like Amazon, Zoom and DocuSign experienced elevated growth in 2020. This was due to Covid keeping people out of stores (many of which weren’t even open). If we look at pre-Covid growth the company’s revenue increased by 45% year/year in Q3 2019. A year later revenue growth had escalated to 96% due to Covid.  In Q3 2021 growth was 46%, returning to pre-Covid levels. The compound 2-year rate of growth was 70%. If Shopify can continue at a 35-40% revenue growth rate it will mean it has absorbed its higher level of revenue and is growing quite nicely from there.

Shopify has established a clear leadership position as the enabler of eCommerce sites. Its U.S. eCommerce market share, at 10.3% in 2021, is second to Amazon and well ahead of its closest competitors Walmart, eBay, and Apple. Net revenue retention for the company continues to be well over 100% as Shopify has successfully expanded services it provides to its eCommerce business customers. Additionally, because successful eCommerce companies are growing, Shopify also grows its portion of the customer revenue it shares.  I expect continued growth to be well over 30% for several more years given three things:

a. Ecommerce should continue to take share from offline.

b. We expect Shopify to continue to gain share of Ecommerce.

c. Shopify will leverage expanded services leading to higher revenue per client.

In 2022 revenue growth is expected to be lower in the first half of the year than the second due to the benefit Covid had on the first half of 2021 and some changes Shopify made in its method of charging customers that took effect in the second half of 2021.

  1. CrowdStrike will outperform the market (it closed at $182 per share)

CrowdStrike continues to gain substantial share of the data security market. Given its leadership position in the newest technology coupled with what is still a modest share of its TAM, the company remains poised for continued high growth. This coupled with over 120% net revenue retention for 12 straight quarters (primarily driven by expanded module purchases) makes CrowdStrike a likely long-term grower at over 50% per year.

The recent threats by Russia to create a Cyber attack on the U.S. could be an additional boost to the entire security industry. CrowdStrike stands to be a disproportionate beneficiary as it has the most advanced technology for defending companies against such attacks.

  1. Amazon will outperform the market (it closed at $3076 per share)

Amazon, like Shopify, benefitted from the substantial number of people who shopped from home in 2020. This caused an expansion of its growth rate from 24% in Q3 2019 to 37% in in Q3 2020. In Q3 2021 growth was down to 15% against the tough compare. Looking at the 2-year compound rate the company appears to have had a modest benefit to growth. We expect the company to return to a 15-20% growth rate in the second half of 2022. This would mean that it has absorbed extra revenue and returned to the normal curve of growth declining. One thing that helped the stock was that higher margin Amazon Web Services (AWS) grew at 40%, much higher than modestly profitable commerce. AWS continues to be quite attractive relative to its peers and its quality and sophistication continues to improve.

A second potential driver for the stock is that new CEO Jassy may decide to increase the focus on earnings growth which is available to Amazon if it chooses to do so. If he does that could be a catalyst to share appreciation. To that end, on the Q4 earnings call the company announced that it would be increasing the cost of Prime by about 17%. This increase will go into effect in Mid-February for new members and in Mid-March for existing members. The impact will roll out over 12 months as existing members renew their annual membership. Despite this increase, Prime remains a distinct bargain as it not only includes free shipping but also a number of other benefits such as video streaming of movies and TV shows, some free eBooks, discounts at Whole Foods and more. Given that Prime has over 200 million members, the increase adds over $4 billion to revenue once it fully rolls out or about 1% of revenue. While this may not appear to be that much, it is worth about $8 per share in pre-tax earnings.

  1. DocuSign will outperform the market (it closed at $115 per share)

DocuSign experienced some of the up and down in growth that Zoom did but to a more moderate extent. Its “normal” pre-Covid growth rate of 40% in Q3 of fiscal 2020 escalated to 53% a year later and then fell back down to 42% in its last reported quarter. As with other high growth stocks DocuSign’s rate would normally have fallen, so the 2-year compound rate of 48% was quite strong. Yet, as I write this letter, the stock is down by over 50% in the past year despite revenue increasing by 42%. This means the multiple of revenue has fallen by about 64% in a year.

As is normal for high growth companies, I expect DocuSign to continue to have a modest decline in revenue escalation from last quarter but believe growth will continue to be above 30% for several years as net retention among enterprise customers (which is 88% of revenue) is over 120% and the company continues to add new customers to this group at a solid pace.  DocuSign is the dominant player in the use of eSignature and other management tools for documents. The use of these tools will be just as important in a post-Covid world.

DocuSign continues to add initiatives to keep Net Retention at or near the 120% level. These include growing its partnership with Salesforce, launching a new release of its software, Agreement Cloud which in addition to eSignature also includes the full cycle of contract creation and management. The company is also working on creating an eNotary product.

  1. Zoom will outperform the market (it closed at $125 per share)

Zoom is a company that has had its revenue trajectory impacted the most by Covid. Before the pandemic, the company was growing revenue at 80%+ in 2019. Such a high growth rate would normally decline the following year but when Covid struck Corporate demand increased by a higher rate than normal and individuals flocked to Zoom in order to maintain some visual contact with friends and family. As a result, Zoom growth peaked at an unheard of 365% in Q2 of fiscal 2021 (reported in calendar Q3 of 2020). As people subsequently began leaving their homes Zoom’s growth was impacted. The corporate side of its business continued to have robust growth with Net Revenue Retention of over 130% as business customers from a year earlier increasing their spend by over 30% including churns. In addition, Zoom had a net add of new customers of 18% of the prior year’s total. Putting those together means that revenue from business customers grew about 45% and continued to grow about 10% sequentially while growth of the consumer side was flattish to slightly down sequentially. Combining the two trends meant that overall growth fell to 35% year over year in Q3 of fiscal 2022 and is expected to decline further in Q4. Looking at the 2-year compound growth rate for revenue in Table 2, one can see that Zoom experienced an elevation to over 150%, nearly double their pre-covid level. We believe that over the longer run Zoom can grow over 30% once the corporate side of its business becomes a bit more dominant and the consumer side begins to show moderate sequential growth. And we expect that sequential growth will begin to rise at some point during calendar 2022 (its fiscal 2023).

GMs were over 81% in FY 2020 (ending January 31, 2020), pre-Covid. The impact of free use to schools with students being on Zoom 8 hours a day, a major expansion of consumer free users, plus paying users expanding use without generating extra revenue (there is no charge for increasing usage) caused GMs to decline to under 70% in FY 2021. By Q3 FY 2022 GM had returned to 76%. We believe further improvement in GMs is inevitable as Covid declines and usage rates diminish without impacting revenue. This should mean that earnings increase at a faster rate than revenue assuming the company keeps G&A growth at or lower than revenue growth.

2022 Non-Stock Invitations

  1. Republicans will recapture at least one of the Senate and House in the Interim elections

Since the Biden administration has taken power, inflation has surged to its highest rate since the Carter administration, the Ukraine crisis has emerged, Covid cases have jumped and Biden leadership and mental sharpness have come into question. While several of these issues may have come to the front no matter who was president, an ABC News/Washington Post poll shows the electorate clearly is dissatisfied. Biden’s approval rating has fallen to 37% and people believe by over a 2 to 1 margin that the Republicans would do a better job handling the economy.  The poll results show that if the House elections were held today, 49% would vote Republican and 42% Democrat. Given how tenuous the Democrats majority is, this would likely lead to a change of control. It is only late February so there is still time for this to change, but many of these issues, especially the economy, may be hard to turn before the November election.

  1. The travel industry will experience robust growth starting in the summer of 2022

The travel industry has had a pretty rocky 2020 and 2021 as Covid elicited substantial fear of boarding a plane, traveling out of the country and/or taking a cruise. In 2021, we did see a return to travel within the U.S. and it was accompanied by increasing prices of hotel rooms and restaurants. It seems clear (to me at least) that people are worn down by Covid and appear ready to resume some of their prior vacation habits. While new Covid cases are still at very high levels (but falling rapidly), the current version is much less deadly than prior ones. In my group of friends, several of us have planned a trip to France in May which will be the first time back in Europe for any of the 4 couples since 2019. While I’m less certain of when cruise lines will be back to normal, I expect them to see some renaissance this year. The only fly in the ointment is how serious the Russian crisis becomes. As of now I believe it will be restricted (from a military point of view) to the Ukraine.

  1. PG&E and other utility companies will battle to dramatically increase what they charge those who convert to solar

There is a massive conflict between the drive to replace energy received from the grid with solar panels. On the one hand the U.S. government provides a 26% tax rebate for installing solar panels. And states like California are pushing to drive more solar through a net metering law (and in the past tax rebates). Also, California is now mandating roof solar panels for all new homes. On the other hand, utility companies like the three in California are battling to increase charges to those that install solar as an offset to the revenue they would lose. The Solar Rights Alliance estimates that “going big on Solar” could save American households over $473 billion over 30 years, whereas “doubling down” on new powerline installation would add $385 billion in cost to American households. When a household converts to solar, energy companies lose revenue and these companies are intent on increasing the cost to solar users to offset this.

Net Metering means a household can sell back excess energy produced to their utility company, which in turn offsets any cost they incur on days when their solar falls short of needs and they need to buy from the utility. The dollars they were entitled to by selling back is then deducted from the bill for energy used. Before 2016 the price the utility company paid for the excess they bought was equal to the price they sold energy back to the consumer. As more homes installed solar the energy companies pushed for a change and in 2016 NEM 2.0 was passed. This allowed the utilities to charge $ 0.03 per kWh for power they sold back to consumers. It also added an interconnect fee of $145 or more to PG&E and different amounts for the other California utility companies. Further, it established a policy of varying rates based on the time of day (which meant higher charges on energy purchased during the middle of very hot days).

Still, as more and more households install solar (including all new homes), the utility companies view it their right to be able to increase charges so they can grow revenue. There has been a push before the California Public Utilities Commission to pass NEM 3.0. It would allow the 3 major utility companies to charge between $56 and $91/month to any home with a new installation of solar. Additionally, it would slash the credit for selling back energy. If it had passed this would have added significant cost to homes with solar and likely reduced the number of existing homes that install it by 70% or more. For now, the public furor over NEM 3.0 caused the PUC to postpone action on this indefinitely. Instead, a large rate increase was granted to PG&E to help pay for remediating their negligence that contributed to California fires.  But this battle is far from over!  I’m expecting some sort of political compromise on new charges to solar homes to occur when the furor dies down. It likely will lower the added charges from the prior proposal but still increase the cost. While I am predicting this increase in 2022, it may not happen until 2023.

  1. If Green comes back at full capacity the Warriors will win the NBA Championship

As usual I had to have my one fun pick. Clearly this is not a “gimme” and maybe shows my fan bias. In fact, the Warriors have serious issues even getting to the championship game as the Suns have been playing great and Memphis is on the rise and easily could beat out the Warriors for second in the West. This means the Warriors could need to overcome home court advantages for each of those teams assuming each of the three wins in earlier rounds. But, before Green was injured, the Warriors were the top defensive team in the league and also playing quite well on offense and Klay Thompson had yet to play.  Since his injury Kuminga has emerged as another strong cog in the Warrior wheel and Klay appears to be working towards his former production by the playoffs.

In last year’s top ten I pointed out that Wiggins was likely to shine for the Warriors and he has certainly done that on offense and defense this year. Despite a so-called slump, Curry is still the best shooter on the planet and will likely return to full form when Green returns as its no coincidence that his tail-off started under the pressure of breaking the 3-point scoring record but has mostly been with Green out. Poole has developed into a strong 6th man who is capable of providing a scoring boost when needed. Looney could benefit from a little easing of his minutes coming into the playoffs as he was playing his best basketball ever for most of the season. Iguodala should be very additive in the playoffs, assuming he is healthy. Finally, Gary Payton is a game changer on defense and Kerr has been using him very effectively.

Some thoughts on risk arbitrage

I promised a new post within 3 weeks of the last one. It’s here…but is different than originally planned! Several recent M&A events have motivated me to try to explain some basics on what happens to associated stocks in such a situation, the most recent being the Zoom acquisition of Five9. If the acquisition is a stock for stock transaction (as the Zoom one is), the acquirors stock will usually decline in price right after the announcement of the deal.  The reason for the inevitable next day decline of the acquirer’s stock can be misunderstood. In this post I will explain why the decline has little to do with investors reaction to the quality of the acquisition.

What happens when a stock for stock acquisition of a public company is announced?

When a public company offers to acquire another, it is quite usual for the offer to be at a premium to the current stock price of the target company. Without a premium there is little motivation for the target company to accept the offer, and it can create a legal issue – as class action attorneys are vigilant to find opportunities to sue and can claim that the target sold out too “cheaply”.

Assuming the number of shares involved is a material amount, then once the deal is made public, the stock of the acquirer will almost always decline the next day while the target’s price rises. The press often interprets this as “The Street” being negative on the acquisition, when in fact it has little to do with a critique of the deal. Instead, it stems from “Risk Arbitrage” where arbitragers will short the acquirer’s stock and buy the target’s stock to create a certain profit if the acquisition is consummated. To illustrate this, I will use an easy-to-understand example:

Suppose Company A is trading at $100/share and then offers to acquire Company B (trading at $60/share). Suppose the offer is one share of Company A stock for each share of Company B stock. At these prices an arbitrager can:

  1. Buy Company B stock at $60/share – this equates to buying Company A stock at a discount if and when the deal closes since each share of B will then convert to one share of A
  2. Short Company A stock and receive $100/share

The net result is a gain of $40/share assuming the deal consummates. This occurs because when the share of B is converted to a share of A it can be used to cover the short position without the arbitrager spending any money. The Arbitrager will continue to do this as long as there is a gap between the prices of the shares. Given the number of shares being sold, A’s stock price will usually fall (the next day) and B’s will rise until it is virtually equal to A’s price on an as converted basis. The difference once this reaches equilibrium is the “risk premium”.

The reason it’s called “Risk Arbitrage” is that if the deal falls apart money could be lost. Therefore, a smart arbitrager will assign a risk premium based on his or her assessment of the probability that the deal will break. Once the 2 stocks are in sync, they will continue to trade in sync with the difference in prices being the risk premium. This will probably mean that the acquirer’s stock will return to around its prior price a few days later plus or minus its normal fluctuation, and the premium or discount assigned by investors to the deal.

Using Zoom Acquisition of Five9 as a Real Example

For an actual example, lets review the Zoom acquisition of Five9 announced on Sunday July 18, 2021. The agreement was to exchange each share of Five9 for 0.5533 shares of Zoom. At the close of the market on Friday, July 16 (just before the announcement):

  1. Zoom shares were at $361.97 and Five9 shares were at $177.60
  2. The theoretic value of a Five9 share based on 0.5533 of a Zoom share was $200.28 a 13% premium to the July 16 Five9 share price.

By the close on Monday July 19, Zoom shares had declined to $354.20 and Five9 shares had increased in price to $188.12. I saw many articles interpreting the Zoom drop in price as investors being negative on the deal. However, I believe it was the result of the volume of Zoom stock shorted by arbitragers.

Since 0.5533 times the Zoom price of $354.20 is $195.98 there was still a discrepancy in the ratio between the two stocks versus the ultimate conversion multiple of 0.5533 since Five9 was trading at 4.01% lower than the exchange ratio implied it was worth. This meant that Arbitragers were initially assigning a 4.01% risk factor based on the odds the deal would close. Once the two stocks settled into the appropriate ratio they have traded in sync since (less the Risk Premium). The risk premium has declined slightly in the two weeks since the deal was announced as arbitragers began to assess a lower risk factor to the odds the deal would break.

This same pattern usually occurs each time a stock for stock transaction is announced. There is too much money to be made from the arbitrage if the two stocks don’t adjust based on the conversion ratio. Any time they get out of sync arbitragers will step in again. When they initiate a pair of transactions the combination of buying stock in the target and shorting stock in the acquirer generates an immediate profit in cash. In our example of Zoom if the stocks were still at the July 16 price a transaction could be:

  1. Buy 10,000 shares of Five9 at $177.60 at a cost of $1,776,000
  2. These shares would convert to 5,533 shares of Zoom when the acquisition closes
  3. Sell short 5,533 shares of Zoom at $361.97/share to receive $2,002,780
  4. Immediate cash to arbitrager = $2,002,780 – $1,776,000 = $226,780
  5. If and when the acquisition closes the arbitrager would net a profit of $226,780
  6. If the deal breaks there could be a loss as the Zoom share short would need to be covered and the Five9 shares sold. This is why there is a risk premium involved.

Of course, the July 16 prices disappeared quickly when the stocks opened on July 19 as the arbitragers begin to execute their transactions. But as long as the difference exceeded the risk premium, they continued to transact to realize an immediate cash return. Once equilibrium was reached arbitragers ceased transacting (unless the stocks were to get out of sync again).

Conclusion

If you own a stock making a major acquisition and its stock price drops the day after the transaction is announced, the drop is likely to be temporary. Of course, there are situations where investors actually are so negative towards the transaction that the acquirer stock does not recover, but the first day drop usually has little to do with that.   

Why spending on branding can be a key to long-term success

A friend called me the other day and inquired as to whether I was ok, as I had not posted in several months. While my goal has been to do about 10 blog posts per year, my frequency has always been erratic, and this year has really been sparse. To make things up, I am going to try for 2 new posts in the next 3 weeks or so that stem from the Azure Marketing Day, held each year for our portfolio companies to gain exposure to advanced techniques across multiple marketing areas. Since the speakers are truly knowledgeable of their arena, using one or two talks as a basis of a post makes me look good!

This post will focus on branding and how to measure whether it is working. The next will delve into direct (snail mail) marketing and how some companies are finding it quite effective.

How to measure the efficacy of brand campaign spend

Spending on branding is quite different than spending for customer acquisition. While many ads serve both purposes, the difference is based on whether there is a direct call for action…usually to buy something. For simplicity, I assume that if there is a call for action, the ad is for customer acquisition, if there is no call for action the ad is for branding.

By improving their brand, a company can experience:

  1. Higher conversion rates on its customer acquisition spend
  2. An increase in the number of people who visit their site
  3. An increase in the LTV (lifetime value) of customers

One method of measuring whether a branding campaign is effective is to determine whether people in the geography where the marketing takes place become more aware of the brand. This is done by measuring the awareness of the brand both before and after the campaign. The most common measure for younger companies is called “Aided Brand Awareness”. Aided brand awareness is determined by conducting a survey of a statistically significant random sample of the population of the geography. In the survey, each person is asked to say which of a list of products/companies they recognize. The percentage that picks the product or company as one they know of is designated as the Aided Brand Awareness.  Most TV ads are for improving brand awareness, whereas a large proportion of online ads are for customer acquisition.

While it may seem surprising now, when I was on Wall Street covering Microsoft (and others), Bob Herbold, Microsoft COO, believed a lack of universal brand awareness was limiting the company. So, Microsoft engaged in a significant spend to raise its brand awareness from well below 50% (as I recall) before the campaign. It was one of the many smart strategies the company used to become what they are today. An improved brand helped drive a massive gain in market share for Microsoft productivity applications.

At the Azure Marketing Day, Chris Bruzzo, EVP Marketing and Commercial at Electronic Arts, provided a session on the importance of branding. He outlined one method of testing the potential effectiveness of a branding campaign without breaking the bank. He suggested, if possible, to start by picking matched geographies for a test. You then conduct the branding campaign in the test location and compare results to the control (the second location). By limiting the test to a few geographies, the cost can be kept reasonable while acquiring information on how much impact a branding campaign could have on your company. EA found advertising to improve its brand was quite effective. While I can’t cite EA data due to a public company’s need for confidentiality, I can say it led to higher customer Life Time Value and an increase in the success of customer acquisition campaigns in the test geographies. I have been given permission to review a similar test conducted by Azure portfolio company Chairish.

Chairish recently conducted a test of whether spending on branding would prove beneficial. They decided to select 3 cities for the test. For confidentiality, I’ll refer to them as Test Cities 1, 2 and 3. Each was measured against a control city where no branding spend was done. The paired cities, control cities 1, 2 and 3, respectively, each had similar population demographics to the test city it was paired with. The first measurement of benefit was the change in Aided Brand Awareness. Pre-campaign the test cities averaged 6% awareness and the control cities 8%. Post campaign the test cities increased to 13% awareness and the control cities to 9%. So, the lift for the test cities was 7% and for the control cities 1%. I believe that the control cities represented the natural gain the company was getting without a branding campaign, while the branding campaign added an additional 6% of the population to those aware of its brand.

Comparing Test Cities to Control Cities for Branding Campaign  

The table shows the average benefit of the marketing campaign across the test cities when compared to their matched control. For example, during the test period the increase in average overall revenue was 23% greater in the test cities than in their paired control locations. A month later, the difference in gain had improved to 25.8%. The reason for such large revenue gains stems from some of the other metrics measured, especially the massive gain in registrations because of the branding campaign.

Given these results, Chairish will be increasing its spend on branding. For those of you who decide to try a branding campaign, it is important to make sure you can measure results. Once the results are in hand, the next step is to compare revenue and gross margin dollar gains to the cost of the campaign. This allows a company conducting a branding campaign to understand the initial incremental cost and the time to recover the investment. Having that in hand allows for a reasonable forecast of the cash flow implications of increasing the spend for branding. One caveat is, while hard to forecast, there is also often the benefit of an increase in customer LTV (life-time value) as greater awareness of the brand also spurs more visits (and spend) from existing customers but this is more difficult to measure in the short run.

While mature companies typically spend a portion of advertising on branding and conduct these types of Aided Brand Awareness measures many younger companies do not consider this. As companies cross the $20-30 million threshold, we believe they should consider experimenting with a brand spend in the manner discussed in this post. Many will find that it is another valuable tool to use as part of marketing spend.

Soundbytes

In our post on September 10, 2020, A Counter Theory to Potential Recession (during week 26 of Shelter in Place), we advocated a counter-theory to widespread predictions that there would be a recession as the pandemic ebbed, stating:

“Much of the public dialogue concerning the economic effect of Covid19 has centered around the large number of people who have lost income, with the conclusion that the US will potentially experience a continued recession going forward. What seems to be lost in the discussion is that the 90% of the labor force that is employed is saving money at an unprecedented rate. This has occurred partly through fear of future loss of income but mostly by a reduction in spending caused by the virus.”

We estimated that consumers would save trillions of incremental dollars if Covid lasted through year end. And that a large portion of it would subsequently be spent on furniture, luxury items, vacations and more. This is now occurring, leading to substantial increased demand for many goods and services and inflationary pressure.

The pressure of this increased spend coupled with continued supply chain issues due to Covid provides the opportunity to keep prices firm (or even increase them) as demand will outstrip supply in many sectors, possibly through year end. 

The Top 10 List for 2021

Professional Sports in a Covid World

I wanted to start this post by repeating something I discussed in my top ten lists in 2017, 2018 and 2020 which I learned while at Sanford Bernstein in my Wall Street days: “Owning companies that have strong competitive advantages and a great business model in a potentially mega-sized market can create the largest performance gains over time (assuming one is correct).” It does make my stock predictions somewhat boring (as they were on Wall Street where my top picks, Dell and Microsoft each appreciated over 100X over the ten years I was recommending them).

In the seven years we have been offering stock picks on this blog this strategy has worked quite well as the cumulative gains for my picks now exceeds 21X and the 7-year IRR is 55%. The two stocks that have been on the list every year, Tesla and Facebook, were at the end of 2020 at 77X and 11X, respectively, of the price I bought them in mid-2013. They both have been on our recommended list every year since but this is about to change.

In last year’s Top 10 list I pointed out that my target is to produce long-term returns at or above 26%. At that rate one would double their money every 3 years. Since the S&P has had compound growth of 10.88%/year for the past 7 years, and Soundbytes has been at 55%, I thought you might find it interesting to see how long a double takes at various levels of IRR and what multiple you would have after 10 years for each one.

Table: Compound Returns at Various Rates

The wonder of compounding is quite apparent in the table, but it also shows that patience is a virtue as holding the stocks of great companies longer can multiply your money significantly over time, while too many investors become inpatient and sell prematurely. In our last post of 2020 we outlined the thinking process to select great companies, but even great companies can have some periods where their returns are below par. Given that our picks were up an average of 259% last year, I’m back to a fearful mode that 2021 might be that period. Of course, I’m always fearful but sticking with great companies has worked out so far and trying to time when to sell and buy back those companies often leads to sub-optimization.

To some extent, over a 5-year period or longer, stock appreciation is correlated with a company’s growth. So, as I go through each of my 6 stock picks, I will discuss what that might mean for each company. With that in mind, as is my tendency (and was stated in my last post), I am continuing to recommend 5 of the 6 stocks from last year: Tesla, Zoom, Amazon, Stitch Fix and DocuSign. I am removing Facebook from the list and adding CrowdStrike. To be clear, I still believe Facebook will outperform the S&P (see Pick 7 below) but I also believe that over the next few years CrowdStrike and the 5 continuing stocks will experience greater appreciation.

2021 Stock Recommendations:

1. Tesla stock appreciation will continue to outperform the market (it closed last year at $706/share)

Tesla is the one stock in the group that is not trading in synch with revenue growth for a variety of reasons. This means it is likely to continue to be an extremely volatile stock, but it has so many positives in front of it that I believe it wise to continue to own it. The upward trend in units and revenue should be strong in 2021 because, in addition to continued high demand for the model 3:

  1. China Expansion: Tesla continues to ramp up production in China, the world’s largest market. In 2020 the company sold about 120,000 cars (which placed it a dominant number 1 in battery powered cars) there as its Giga Factory in Shanghai ramped up production. Trade Group China Passenger Car Association predicts that Tesla will sell as many as 280,000 vehicles there in 2021…an increase of about 133%. While that is significant growth it only would represent 20% of the number of battery powered vehicles forecast to be sold. The limitation appears to be production as the Shanghai factory is just nearing a volume of 5,000 vehicles per week. Tesla believes it can double that during this year. The Model Y has just been introduced in China and early press is calling it a major hit. Together with the Model 3, I believe this positions Tesla to be supply constrained. Should the company increase production earlier in the year, it has the opportunity to sell more than the forecast 280,000 vehicles. What is also important to note, is Tesla seems to be making greater profits on sales of its cars in China than in the U.S so as China becomes a larger portion of the mix Gross Margin could increase.
  • European Factory: Tesla has a cost disadvantage in Europe as its cars are not currently built there. So, while it established an early lead in market share, as others have launched battery powered vehicles at lower prices Tesla lost market share. That should all change when its Berlin Giga Factory begins production in July, 2021. This coupled with the Model Y introduction (it will be built in the Berlin factory) should mean a notable increase in sales as Europe returns to more normal times.
  • Model Y introduction: The Model Y, launched in early 2020 in the U.S., is already selling about 12,000 units a month here. This exceeds sales of crossover vehicles from every major brand (per GCBC which uses VIN reporting to calculate its numbers). It is expected to start being delivered in China in February.
  • Cybertruck: The Cybertruck (see our graphic here) was introduced to extremely mixed reactions. Traditionalists tended to hate it due to its radical departure from what they have come to expect for a pickup truck from companies like Ford, Toyota, etc. But it rang a cord with many and pre-orders are now up to 650,000 units according to Finbold. To give perspective on what this means, it is 30% higher than the total number of vehicles Tesla sold in 2020.  While a portion of these orders could be cancelled as they only required a $100 deposit, the magnitude does imply significant incremental demand when Tesla launches in this category. The launch is expected late this year.
  • Roadster: Tesla has plans to re-introduce a Roadster in 2021. You may recall that the first Tesla’s were sports cars and are now collectors’ cars mostly valued between $50,000 and $70,000 but now the last one built, having about 200 miles on it is up for sale at $1.5 million. This time around it will make it an ultra-premium vehicle in specifications and in price. The base price Tesla has indicated starts at $200,000. A “Founders Series” will be $50,000 higher (with only 1,000 of those available). At those prices, gross margins should be quite high.  The range Tesla initially indicated for this car was 620 miles and the speed from 0 to 60 of 1.9 seconds which would be much quicker than the McLaren 570S gas powered auto.
  • Tesla Semi: of all the vehicle categories that would benefit from being battery powered I believe the Semi is on top. That is because cost of ownership is one of the highest priorities for vehicles used in commerce. And Tesla claims that their semi will offer the lowest cost of ownership due to economic cost of fuel, less maintenance required as it has fewer parts, and easier repairs. According to Green Car Reports Musk has said it will begin being produced in 2021. Even assuming that Elon’s optimism is off, it appears that it could hit the market in early 2022. Once a definite date and specs are public, sales forecasts for Tesla could rise in 2022.

I’ve taken more time than usual to review my thoughts on Tesla as its astounding stock appreciation in 2020 make it vulnerable to stock pullbacks of some magnitude from time to time. But, its potential to achieve meaningful share of overall auto sales as various geographies shift to battery powered vehicles gives it the potential to achieve high growth in revenue for many years to come.  

2. DocuSign stock appreciation will continue to outperform the market (it closed last year at $222/share)

DocuSign is the runaway leader in e-signatures facilitating multiple parties signing documents in a secure, reliable way for board resolutions, mortgages, investment documents, etc. Being the early leader creates a network effect, as hundreds of millions of people are in the DocuSign e-signature database. The company has worked hard to expand its scope of usage for both enterprise and smaller companies by adding software for full life-cycle management of agreements. This includes the process of generating, redlining, and negotiating agreements in a multi-user environment, all under secure conditions. On the small business side, the DocuSign product is called DocuSign Negotiate and is integrated with Salesforce.

DocuSign was another beneficiary of the pandemic as it helped speed the use of eSignature technology. The acceleration boosted revenue growth to 53% YoY in Q3, 2021 (the quarter ended on October 31, 2020) from 39% in Fiscal 2020.  Total customers expanded by 46% to 822,000. At the same time Net Retention (dollars spent by year-ago customers in Q3 FY21 vs dollars spent by the same customers a year earlier) was 122% in the quarter. Non-GAAP gross margin remained at 79% as increased usage per customer (due to the pandemic) had minimal impact on cost. Given DocuSign’s strong Contribution Margin, operating profits increase faster than revenue and were up to $49 million from $17 million in the year ago quarter. What has happened represents an acceleration of the migration to eSignature technology which will be the base for DocuSign going forward. Once a company becomes a customer, they are likely to increase their spend, as evidenced by 122% Net Revenue growth. Finally, competition appeared to weaken as its biggest competitor, Adobe, lost considerable ground. This all led to a sizable stock gain of 200% to $222/share at year end.  In my view, the primary risk is around valuation but at 50% growth this gets mitigated as earnings should grow much faster than revenue. I continue to believe the stock will appreciate faster than the S&P.

3. Stitch Fix Stock appreciation will continue to outperform the market (it closed last year at $58.72/share)

Stitch Fix offers customers, who are primarily women (although its sales in Men’s clothing is rising), the ability to shop from home by sending them a box with several items selected based on sophisticated analysis of their profile and prior purchases. The customer pays a $20 “styling fee” for the box which can be applied towards purchasing anything in the box. The company is the strong leader in the space with revenue at nearly a $2 billion run rate. The stock had a strong finish to 2020 after declining substantially earlier in the year due to Covid negatively impacting performance. This occurred despite gaining market share as people simply weren’t buying a normal amount of clothes at the onset of the pandemic. When revenue growth rebounded in the October quarter to 10% YoY and 7% sequentially the stock gained significant ground and closed the year up 129%.

Stitch Fix continues to add higher-end brands and to increase its reach into men, plus sizes and kids. Its algorithms to personalize each box of clothes it ships keeps improving. It appears to be beyond the worst days of the pandemic and expects revenue growth to return to a more normal 20-25% for fiscal 2021 (ending in July). This is partially due to easy comps in Q3 and Q4 and partly due to clothing purchase behavior improving. The company will also be a beneficiary of a number of closures of retail stores.

Assuming it is a 20-25% growth company that is slightly profitable, it still appears under-valued at roughly 3X expected Q2 annualized revenue. As a result, I continue to recommend it.

4. Amazon stock will outpace the market (it closed last year at $3257/share).

Amazon shares increased by 76% last year while revenue in Q3 was up 37% year over year (versus 21% in 2019). This meant the stock performance exceeded revenue growth as its multiple of revenue expanded in concert with the increased revenue growth rate. Net Income grew 197% YoY in the quarter as the leverage in Amazon’s model became apparent despite the company continuing to have “above normal” expenditures related to Covid. We expect the company to continue at elevated revenue and earnings growth rates in Q4 and Q1 before reaching comps with last year’s Covid quarters. Once that happens growth will begin to decline towards the 20-25% level in the latter half of 2021.

What will remain in place post-Covid is Amazon’s dominance in retail, leading share in Web Services and control of the book industry. Additionally, Amazon now has a much larger number of customers for its Food Services than prior to the pandemic. All in all, it will likely mean that the company will have another strong year in 2021 with overall growth in the 25-30% range for the year and earnings growing much faster. But remember, the degree earnings grow is completely under Amazon’s control as they often increase spend at faster rates than expected, especially in R&D.

5. Zoom Video Communications will continue to outperform the market (it closed last year at $337/share)

When I began highlighting Zoom in my post on June 24, 2019, it was a relatively unknown company. Now, it is a household name. I’d like to be able to say I predicted that, but it came as a surprise. It was the pandemic that accelerated the move to video conferencing as people wanted more “personal contact” than a normal phone call and businesses found it enhanced communications in a “work at home world”. Let me remind you what I saw in Zoom when I added it to the list last year, while adding some updated comments in bold:

  1. At the time, Revenue retention of business customers with at least 10 employees was about 140%. In Q3, FY 2021 revenue retention of business customers was still 130% despite pandemic caused layoffs.
  2. It acquires customers very efficiently with a payback period of 7 months as the host of a Zoom call invites various people to participate in the call and those who are not already Zoom users can be readily targeted by the company at little cost. Now that Zoom is a household name, acquiring customers should be even less costly.
  3. At the time, Gross Margins were over 80% and I believed they could increase. In Q3, GM had declined to 68% as usage increased dramatically and Zoom made its products available to K-12 schools for free. Given that students were all mostly attending school virtually, this is a major increase in COGs without associated revenue. When the pandemic ends gross margins should return close to historic levels – adding to Zoom profits. 
  4. The product has been rated best in class numerous times
  5. Its compression technology (the key ingredient in making video high quality) appears to have a multi-year lead over the competition
  6. Adding to those reasons I noted at the time that ZM was improving earnings and was slightly profitable in its then most recent reported quarter. With the enormous growth Zoom experienced it has moved to significant profitability and multiplied its positive cash flow.

While ZM stock appreciated 369% in 2020, it actually was about equal to its revenue growth rate in Q3 2020, meaning that the price to revenue was the same as a year earlier before despite:

  • Moving to significant profitability
    • Becoming a Household name  
    • Having a huge built-in multiplier of earnings as schools re-open

6. CrowdStrike will outperform the market (it closed 2020 at $211/share and is now at 217.93)

When I evaluate companies, one of the first criteria is whether their sector has the wind behind its back. I expect the online security industry to not only grow at an accelerated pace but also face an upheaval as more modern technology will be used to detect increased attacks from those deploying viruses, spam, intrusions and identity theft. I suspect all of you have become increasingly aware of this as virus after virus makes the news and company after company reports “breaches” into their data on customers/users.

The U.S. cyber security market was about $67 billion in 2019 and is forecast to grow to about $111 billion by 2025 (per the Business Research Company’s report). Yet Cloud Security spend remains at only about 1.1% of total Cloud IT spend (per IDC who expects that percent to more than double). CrowdStrike is the player poised to take the most advantage of the shift to the cloud and the accompanying need for best-in-class cloud security. It is the first Cloud-Native Endpoint Security platform. As such it is able to monitor over 4 trillion signals across its base of over 8500 subscription customers. The companies leading technology for modern corporate systems has led to substantial growth (86% YoY in its October quarter). It now counts among its customers 49 of the Fortune 100 and 40 of the top global 100 companies.

Tactically, the company continues to add modules to its suite of products and 61% of its customers pay for 4 or more, driving solid revenue retention. The company targets exceeding 120% of the prior year’s revenue from last year’s cohort of customers. They have succeeded in this for 8 quarters in a row through upselling customers combined with retaining 97% – 98% of them. Because of its cloud approach, growing also has helped gross margins grow from 55% in FY 18 to 66% in FY 19 to 72% in FY 20 and further up to 76% in its most recent quarter. This, combined with substantial improvement in the cost of sales and marketing (as a % of revenue) has in turn led to the company going from a -100% operating margin in Fiscal 2018 to +8% in Q3, FY21. It seems clear to me that the profit percentage will increase dramatically in FY22 given the leverage in its model.  

Non-Stock Picks for 2021

7. Online Advertising Companies will Experience a Spike in Growth in the Second Half of 2021

The pandemic hit was devastating for the travel industry, in-person events and associated ticket sellers, brick and mortar retailers and clothing brands.  Rational behavior necessitated a dramatic reduction of advertising spend for all those impacted. U.S. advertising revenue declined by 4.3% to $213 billion, or around 17% according to MagnaGlobal, if one excludes the jump in political advertising (discussed in our last post), with Global spend down 7.2%. That firm believes digital formats grew revenue about 1% in 2020 (with TV, radio and print declining more than average). Digital formats would normally be up substantially as they continue to gain share, so the way to think about this is that they experienced 10-20% less revenue than would have occurred without Covid.

Assuming things return to normal in H2 2021, digital advertising will continue to gain share, total industry revenue will be higher than it would have been without Covid (even without the increased political spending in 2020) and comps will be easy ones in H2 of 2021.  While there will not be major political spending there could be Olympic games which typically boost ad spend. So, while we removed Facebook from our 6 stock picks, it and other online players should be beneficiaries.

8. Real Estate will Show Surprising Resiliency in 2021

The story lines for Real Estate during the pandemic have been:

  1. The flight to larger outside space has caved urban pricing while driving up suburban values
  2. Commercial real estate pricing (and profits) is collapsing, creating permanent impairment in their value for property owners with post-pandemic demand expected to continue to fall

My son Matthew is a real estate guru who has consulted to cities like New York and Austin, to entities like Burning Man and is also a Professor of Real Estate Economics at NYU. I asked him to share his thoughts on the real estate market.

Both Matthew (quoted below) and I disagree with the story lines. I believe a portion of the thinking regarding commercial real estate pricing relates to the collapse of WeWork. That company, once the darling of the temporary rental space, had a broken IPO followed by a decline in value of nearly 95%. But the truth is that WeWork had a model of committing to long term leases (or purchasing property without regard to obtaining lowest cost possible) and renting monthly. Such a company has extreme risk as it is exposed to downturns in the business cycle where much of their business can disappear. Traditional commercial property owners lease for terms of 5 to 25 years, with 10-15 years being most common, thus reducing or even eliminating that risk as leases tend to be across business cycles. The one area where both Matthew and I do believe real estate could be impacted, at least temporarily, is in Suburban Malls and retail outlets where Covid has already led to acceleration of bankruptcies of retailers a trend I expect to continue (see prediction 10).

The rest of this prediction is a direct quote from Matthew (which I agree with).

“Real estate in 2021 will go down as the year that those who do not study history will be doomed to repeat it. The vastly overblown sentiments of the “death of the city” and the flight to the suburbs of households and firms will be overshadowed by the facts. 

In the residential world, while the market for rentals may have somewhat softened, no urban owners have been quick to give up their places, in fact, they turned to rent them even as they buy or rent roomier locations within the city or additional places outside the cities, driving up suburban prices more quickly. In fact, even in markets such as NYC, per square foot housing sale prices are stable or rising. US homebuilding sentiment is the highest in 35 years, with several Y/Y growth statistics breaking decades long records leading up to a recent temporary fizzle due to political turmoil. 

The commercial office world, which many decry as imminently bust due to the work at home boom, has seen a slowdown of new leases signed in some areas. But because most commercial office leases are of a 10–15-year term, a single bad year has little effect. While some landlords will give concessions today for an extended term tomorrow, their overall NPV may remain stable or even rise. In the meantime, tech giants like Amazon are gobbling up available space in the Seattle and Bellevue markets, and Facebook announced a 730,000 square foot lease in midtown Manhattan late in the year. In the end, the persistence of cities as clusters of activity that provide productivity advantages to firms and exceptional quality of life, entertainment options, restaurants and mating markets to individuals will not diminish. The story of cities is the story of pandemic after pandemic, each predicting the death of the city and each resulting in a larger, denser, more successful one. 

The big story of real estate in 2021 will be the meteoric rise of industrial, which began pre-COVID and was super charged as former in-person sales moved to online and an entire holiday season was run from “dark stores” and warehouses. The continual build out of the last mile supply chain will continue to lower the cost of entry for retailers to accelerate cheaper delivery options. This rising demand for industrial will continue the trend of the creation of “dark stores” which exist solely as shopping locations for couriers, Instacart, Whole Foods and Amazon. Industrial is on the rise and the vaccine distribution problems will only accelerate that in 2021.”

9. Large Brick and Mortar Retailers will continue their downward trend with numerous bankruptcies and acquisitions by PE Firms as consumer behavior has permanently shifted

While bankruptcies are commonplace in the retail world, 2020 saw an acceleration and there was a notable demise of several iconic B&M (Brick & Mortar) brands, including:

It is important to understand that a bankruptcy does not necessarily mean the elimination of the entity, but instead often is a reorganization that allows it to try to survive. Remember many airlines and auto manufacturers went through a bankruptcy process and then returned stronger than before. Often, as part of the process, a PE firm will buy the company out of bankruptcy or buy the brand during the bankruptcy process. For example, JC Penny filed for bankruptcy protection in May, 2020 and was later acquired by the Simon Property Group and Brookfield Property Partners in September, 2020. Nieman Marcus was able to emerge from bankruptcy protection without being acquired. However, in both cases, reorganizing meant closing numerous stores.

There are many who believe things will: “go back to normal” once the pandemic ends. I believe this could not be further from the truth as consumer behavior has been permanently impacted. During the pandemic, 150 million consumers shopped online for the first time and learned that it should now be part of how they buy. But, even more importantly, those who had shopped online previously became much more frequent purchasers as they came to rely on its advantages:

  1. Immediate accessibility to what you want (unlike out of stock issues in Brick and Mortar retail)
  2. Fast and Free shipping in most cases
  3. A more personalized experience than in store purchasing

As older Brick & Mortar brands add online shopping to their distribution strategy, most are unable to offer the same experience as online brands. For example, when you receive a package from Peloton the unboxing experience is an absolute delight, when you receive one from Amazon it is perfectly wrapped. On the other hand, I have bought products online from Nieman Marcus, an extremely high-end retailer, and the clothes seemed to be tossed into the box, were creased and somewhat unappealing when I opened the box. Additionally, a company like Amazon completely understands the importance of customer retention and its support is extraordinary, while those like Best Buy that offer online purchasing fall far of the bar set by Amazon.

What that all means is that many Brick and Mortar retailers will not solve their issues:

  • Adding more of an online push will not be enough
    • Customers that have experienced the benefits of online purchasing will continue to use it in much greater amounts than before the pandemic
    • Ecommerce will continue to take share from Brick and Mortar stores
    •  

As a result, we believe that in 2021 the strain on physical retail will continue, resulting in many more well-known (and lesser known) store chains and manufacturing brands filing for bankruptcy as the dual issues of eCommerce and of the pandemic keeping stores closed and/or operating at greatly diminished customer traction throughout most of the year. Coming on the heels of a disastrous 2020 it will be harder for many of them to even emerge from bankruptcy after reorganizing (including closing many stores). 

10. The Warriors will make the playoffs this Year

I couldn’t resist including one fun pick. We did speak about this in our last post but wanted to include it as an actual 2021 pick. Many pundits had the Warriors as dead before this season began once Klay Thompson was injured. And, of course, more piled on when the team lost its first 2 games by large margins. But they were mis-analyzing several significant factors:

  • Steph Curry is still Steph Curry at his peak no matter who the supporting cast
  • Andrew Wiggins is a superior talent who has the ability to shine on both offense and defense now that he is no longer in a sub-optimal Minnesota environment
  • Kelly Oubre Jr is also talented enough to be a great defender. His offense, while poor so far, is well above average and over the course of the season that should show well
  • Draymond Green is in his prime and remains one of the top defenders in the league. He is also a great facilitator on the offensive end of the floor.
  • James Wiseman is a phenomenon with the talent to be a star. As the season progresses, I expect him to continue to get better and become a major factor in Warrior success
  • Eric Pascal was on the all-rookie team last year and has gotten better

It is clear that the team needs more games to get Curry and Green back into peak playing condition, Wiseman to gain experience and the Warriors to become acclimated to playing together. They have started to show improved defense but still need time to develop offensive rhythm. I expect them to be a major surprise this year and make the playoffs.

SoundBytes

  • Please Wear A Mask: I recently read a terrific book describing the 1918 flu pandemic called The Great Influenza by John Barry. That pandemic was much deadlier than the current one, with estimates of the number of people it killed ranging from 35 million to 100 million when the world population was less than 25% of what it is today. What is so interesting is how much the current situation has replicated the progress of that one. One of the most important conclusions Barry draws from his extensive study of the past is that wearing a mask is a key weapon for reducing the spread.

Recap of 2020 Top Ten Predictions

Tesla’s new pickup truck due out late 2021

Bull Markets have Tended to Favor My Stock Picks

This may seem like a repeat of what you have heard from me in the past, but I enter each year with some trepidation as my favored stocks are high beta and usually had increased in value the prior year (in 2019 they were up about 46% or nearly double the S&P which also had a strong year). The fact is: I’m typically nervous that somehow my “luck” will run out. But, in 2020 I was actually pretty confident that my stock picks would perform well and would beat the market. I felt this confidence because the companies I liked were poised for another very strong growth year, had appreciated well under their growth over the prior 2-year period and were dominant players in each of their sub-sectors. Of course, no one could foresee the crazy year we would all face in 2020 as the worldwide pandemic radically changed society’s activities, purchasing behavior, and means of communication. As it turns out, of the 6 stocks I included in my top ten list 3 were beneficiaries of the pandemic, 2 were hurt by it and one was close to neutral. The pandemic beneficiaries experienced above normal revenue growth and each of the others faired reasonably well despite Covid’s impact. The market, after a major decline in March closed the year with double digit gains. Having said all that, I may never replicate my outperformance in 2020 as the 6 stocks had an average gain of an astounding 259% and every one of them outperformed the S&P gain of 14.6% quite handily.

Before reviewing each of my top ten from last year, I would like to once again reveal long term performance of the stock pick portion of the top ten list. I assume equal weighting for each stock in each year to come up with performance and then compound the yearly gains (or losses) to provide the 7-year performance. I’m comparing the S&P index at December 31 of each year to determine annual performance.  Soundbyte’s compound gain for the 7-year period is 2049% which equates to an IRR of 55.0%. The S&P was up 106.1% during the same 7-year period, an IRR of 10.9%.

2020 Non-Stock Top Ten Predictions also Impacted by Covid

The pandemic not only affected stock performance, it had serious impact on my non-stock predictions. In the extreme, my prediction regarding the Warriors 2020-2021 season essentially became moot as the season was postponed to start in late December…so had barely over a week of games in the current year! My other 3 predictions were all affected as well. I’ll discuss each after reviewing the stock picks.

The 2020 Stocks Picked to Outperform the Market (S&P 500)

  1. Tesla Stock which closed 2019 at $418/share and split 5 for 1 subsequently
  2. Facebook which closed 2019 at $205/share
  3. DocuSign which closed 2019 at $74/share
  4. Stitch Fix which closed 2019 at $25.66/share
  5. Amazon which closed 2019 at $1848/share
  6. Zoom Video Communications which closed 2019 at $72.20/share

In last year’s recap I noted 3 of my picks had “amazing performance” as they were up between 51% and 72%. That is indeed amazing in any year. However, 2020 was not “any year”. The 6 picks made 2019 gains look like chopped liver as 4 of my 6 picks were up well over 100%, a 5th was up over 70% and the last had gains of double the S&P. In the discussion below, I’ve listed in bold each of my ten predictions and give an evaluation of how I fared on each.

1. Tesla stock appreciation will continue to outperform the market (it closed last year at $418/share). Note that after the 5 for 1 split this adjusts to $84.50/share.

In 2020, Tesla provided one of the wildest rides I’ve ever seen. By all appearances, it was negatively impacted by the pandemic for three reasons: people reduced the amount they drove thereby lessening demand for buying a new vehicle, supply chains were disrupted, and Tesla’s Fremont plant was forced to be closed for seven weeks thereby limiting supply. Yet the company continued to establish itself as the dominant player in electronic, self-driving vehicles. It may have increased its lead in user software in its cars and it continued to maintain substantial advantages in battery technology. The environment was also quite favorable for a market share increase of eco-friendly vehicles.

Additionally, several other factors helped create demand for the stock. The 5 for 1 stock split, announced in August was clearly a factor in a 75% gain over a 3-week period. Inclusion in the S&P 500 helped cause an additional spike in the latter part of the year. Tesla expanded its product line into 2 new categories by launching the Model Y, a compact SUV, to rave reviews and demonstrating its planned pickup truck (due in late 2021) as well. While the truck demo had some snags, orders for it (with a small deposit) are currently over 650,000 units.

All in all, these factors led to Tesla closing the year at $706/share, post-split, an astounding gain of 744% making this the largest one year gain I’ve had in the 7 years of Soundbytes.

2. Facebook Stock will outpace the market (it closed 2019 at $205 per share)

Facebook was one of the companies that was hurt by the pandemic as major categories of advertising essentially disappeared for months. Among these were live events of any kind and associated ticketing company advertising, airlines and cruise lines, off-line retail, hotels, and much more. Combine this with the company’s continued issues with regulatory bodies, its stock faced an uphill battle in 2020. What enabled it to close the year at $273 per share, up 33% (over 2x the S&P), is that its valuation remains low by straight financial metrics.

3. DocuSign stock appreciation will continue to outperform the market (it closed 2019 at $74/share)

DocuSign was another beneficiary of the pandemic as it helped speed the use of eSignature technology. The acceleration boosted revenue growth to 53% YoY in Q3, 2021 (the quarter ended on October 31, 2020) from 39% in Fiscal 2020.  Since growth typically declines for high-growth companies this was significant. Investors also seemed to agree with me that the company would not lose the gains when the pandemic ends. Further, DocuSign expanded its product range into contract life-cycle management and several other categories thereby growing its TAM (total available market). Despite increased usage, DocuSign COGs did not rise (Gross Margin was 79% in Q3). Finally, competition appeared to weaken as its biggest competitor, Adobe, lost considerable ground. This all led to a sizable stock gain of 200% to $222/share at year end.

4. Stitch Fix stock appreciation will continue to outperform the market (it closed 2019 at $25.66/share)

Stitch Fix had a roller coaster year mostly due to the pandemic driving people to work from home, which led to a decline in purchasing of clothes. I’m guessing many of you, like me, wear jeans and a fleece or sweatshirt most days so our need for new clothes is reduced. This caused Stitch Fix to have negative growth earlier in the year and for its stock to drop in price over 50% by early April. But, the other side of the equation is that brick and mortar stores lost meaningful share to eMerchants like Stitch Fix. So, in the October quarter, Stitch Fix returned to growth after 2 weak quarters caused by the pandemic. The growth of revenue at 10% YoY was below their pre-pandemic level but represented a dramatic turn in its fortunes. Additionally, the CEO guided to 20-25% growth going forward. The stock reacted very positively and closed the year at $58.72/share up 129% for the year.

5. Amazon stock strategy will outpace the market (it closed last year at $1848/share)

Amazon had a banner year in 2020 with a jump in growth driven by the pandemic. Net sales grew 37% YoY in Q3 as compared to an approximate 20% level, pre-pandemic. Their gains were in every category and every geography but certainly eCommerce led the way as consumers shifted more of their buying to the web. Of course, such a shift also meant increased growth for AWS as well. Net Income in Q3 was up 197% YoY to over $6.3 billion. Given the increase in its growth rate and strong earnings the stock performed quite well in 2020 and was up 76% to $3257/share.

In our post we also recommended selling puts with a strike price of $1750 as an augmented strategy to boost returns. Had someone done that the return would have increased to 89%. For the purposes of blog performance, I will continue to use the stock price increase for performance. Regardless, this pick was another winner.

6. I added Zoom Media to the list of recommended stocks. It closed 2019 at $72.20

When I put Zoom on my list of recommended stocks, I had no idea we’d be going through a pandemic that would turn it into a household name. Instead, I was confident that the migration from audio calls to video conference calls would continue to accelerate and Zoom has the best product and pricing in the category. For its fiscal 2020-year (ending in January, 2020) Zoom grew revenue 78% with the final sequential quarter of the year growth at 13.0%. Once the pandemic hit, Zoom sales accelerated greatly with the April quarter up 74% sequentially and 169% YoY. The April quarter only had 5 weeks of pandemic benefit. The July quarter had a full 3 months of benefit and increased an astounding 102% sequentially and 355% YoY.  Q3, the October quarter continued the upward trend but now had a full quarter of the pandemic as a sequential compare. So, while the YoY growth was 367%, the sequential quarterly growth began to normalize. At over 17% it still exceeded what it was averaging for the quarters preceding the pandemic but was a disappointment to investors and the stock has been trading off since reporting Q3 numbers. Regardless of the pullback, the stock is ahead 369% in 2020, closing the year at $337/share .

In the post we also outlined a strategy that combined selling both put and call options with purchasing the stock. Later in the year we pointed out that buying back the calls and selling the stock made sense mid-year if one wanted to maximize IRR. If one had followed the strategy (including the buyback we suggested) the return would still have been well over a 100% IRR but clearly lower than the return without the options. As with Amazon, for blog performance, we are only focused on the straight stock strategy. And this recommendation turned out to be stellar.

Unusual Year for the Non-Stock Predictions

7. The major election year will cause a substantial increase in advertising dollars spent

This forecast proved quite valid. Michael Bloomberg alone spent over $1 billion during his primary run. The Center for Responsive Politics reported that they projected just under $11 billion in spending would take place between candidates for president, the Senate and the House in the general election. This was about 50% higher than in 2016. Additionally, there will be incremental dollars devoted to the runoff Senate races in Georgia. This increase helped advertising companies offset some of the lost revenue discussed above.

8. Automation of Retail will continue to gain momentum

Given the pandemic, most projects were suspended so this did not take place. And it may be a while before we have enough normalization for this trend to resume, but I am confident it will. However, the pandemic also caused an acceleration in eCommerce for brick and mortar supermarkets and restaurants. I’m guessing almost everyone reading this post has increased their use of one or more of: Instacart, Amazon Fresh, Walmart delivery, Safeway delivery, Uber Eats, GrubHub, Doordash, etc. My wife and I even started ordering specialty foods (like lox) from New York through either Goldbelly or Zabars. Restaurants that would not have dreamed of focusing on takeout through eCommerce are now immersed in it. While this was not the automation that I had contemplated it still represents a radical change.

9. The Warriors will come back strong in the 2020/2021 season

This was my fun prediction. Unfortunately, the combination of injuries and Covid eliminated fun for sports fans. I expected that there would be enough games in 2020 to evaluate whether my forecast was correct or not. Since the season started in late December its premature to evaluate it. Also, I pointed out that the team had to stay relatively healthy for the prediction to work. Guess what? The Warriors have already had 2 devastating injuries (Thompson the critical one, and Chriss, who I expected would help the second team as well).

Yet, several things I predicted in the post have occurred:

  1. The younger players did develop last season, especially Pascal
  2.  The Warriors did get a very high draft choice and at first blush he seems like a winner
  3. The Warriors did use the Iguodala cap space to sign a strong veteran, Oubre.

Given the absence of Thompson, the team will be successful if they make the playoffs. So, let’s suspend evaluating the forecast to see if that occurs in a packed Western Conference despite losing Thompson. Last year they started 4 and 16. For the 2020-2021 season  (as of January 3) they are 3 and 3 and appear to be a much better team that needs time to jell. But the jury is out as to how good (or bad) they will be. 

10. At least one of the major Unicorns will be acquired by a larger player

There were 9 Unicorns listed in the post. Eight are still going at it by themselves but the 9th, Slack, has recently been acquired by SalesForce making this an accurate prediction.

2021 Predictions coming soon

Stay tuned for my top ten predictions for 2021… but please note most of the 6 stocks from 2020 will continue on the list and as usual, for these stocks, we will use their 2020 closing prices as the start price for 2021. For any new stock we add, we will use the price of the stock as we are writing the post.

Soundbytes

I thought I would share something I saw elsewhere regarding New Year’s wishes. In the past most people wished for things like success for themselves and/or family members in one form or another. The pandemic has even transformed this. Today, I believe most people are more focused on wishing for health for them, their family, friends, and an end to this terrible pandemic. Please take care of yourselves, stay safe. We are getting closer to the end as vaccines are here and will get rolled out to all of us over the next 4-6 months.

My approach on public market investing

I have always taken a research driven, multi-pronged approach to identifying attractive publicly traded equity investments, and after reflecting on this approach with a new fund that I am starting, I figured that it would make for an interesting blog post to share this with a broader audience. The companies that I have covered through previous blog posts have been identified through this process. As you likely know if you made some investments based off of my suggestions in the past, they have performed very well!

My Screening Process

I begin with a screening process as follows:

  1. Discover trends that are disruptive to entrenched market participants, expected to continue for over five years, and relate to very large markets
  2. Identify companies that are strong beneficiaries of these trends; and
  3. Evaluate these companies’ competitive advantages that stem from one or more of:
    • superior technology often protected by patents,
    • strong emerging brand,
    • network effect of having built a massive connected audience,
    • high quality leadership,
    • products that are very difficult to replicate, and/or
    • advantageous business model

Companies are identified that pass the above screening. Then I apply a filter to reduce these matches to ones that also are already generating or have an ability to generate strong profits. I believe that the most important metric to evaluate companies that have yet to develop mature business models is contribution margin, i.e.: gross margin minus customer acquisition cost. We have covered contribution margin in past blog posts. Check our post in January 2020 which contains our discussion of sophisticated valuation methodology for more background on how I see this as a key metric for evaluating business models.

Companies passing the above screen are rare and, thus, are both difficult and time-consuming to identify. Each company selected from those that passed the screening will also need to have well above average revenue growth for their respective stages.

My experience indicates that great returns will be realized over a long period of time from companies that have the key attributes described above and, therefore, I expect, generally, to hold the core of each of my positions for an average period of five years or more. This doesn’t mean never selling any shares, but rather holding the majority of shares for that period. I augment my equity investments in portfolio companies by writing both call and put options or other derivatives (we covered an example of this recently with Zoom in my 2020 predictions). Doing this hedges risk of short-term market fluctuation and generates income from option premiums going to zero over the life of the option. Given my concentration on relatively few securities of high growth companies, it is expected that volatility in my portfolio could often exceed that of the overall market. Therefore, I believe it’s important to avoid margin borrowing as this would increase risk and volatility beyond what I think is an acceptable level.

Applying the Strategy to Investing

The first step in my strategy is to identify longer term trends that are disruptive to entrenched leaders of large markets. I believe the following qualify:

  1. Growth of eCommerce: Online purchasing will gain share for another 10 years or more
  2. Shift of services from physical, in-person to virtual: This reduces cost and adds convenience and should persist for many years
  3. Use of video conferencing in place of older audio conferencing: Will continue to further penetrate businesses and also emerge as a “must have” for individual households
  4. Online advertising: It will continue to gain share from other forms as it allows for more precise measurement of effectiveness and promotes immediate ability to purchase
  5. Shift from old generation autos to eco-friendlier (i.e. electric) with software capabilities tightly integrated: It is in its early stages and will gain increasing traction for several decades to come
  6. The entire online security industry will not only grow at an accelerated pace but also face an upheaval as more modern technology will be used to detect increased attacks from those deploying viruses, spam, intrusions and identity theft
  7. Web Services will continue to experience double digit growth: Since its directly tied to Internet traffic driven by increased eCommerce, escalation of video, social and virtual services

Several companies that I have selected (and outlined in the past) benefit from more than one of the 7 identified trends and all are one of the dominant players in their particular arena. It should be noted that the arena may be more specific than the trend.

For example, Online advertising has distinct leaders in overall social (Facebook), search advertising (Google), Visual advertising (Pinterest), eCommerce ads (Amazon) and programmatic (The Trade Desk). So, while these 5 companies compete for advertising budget, they each are the dominant brands in their sub-sector with massive networks of users that are difficult to replicate.

Picking the winners

In the first section of this blog, I highlighted six different types of competitive advantages I look for. The companies that I have recently invested in have three or more of these advantages, and on average qualifies for roughly 4.5. On the leadership side not only do all have very strong leadership but virtually all are led by their founder who is an early innovator in their sector.

One other major consideration recently has been the impact of the pandemic. There are three companies that I have previously covered in the blog that I feel benefit strongly: Amazon, DocuSign, and Zoom. Both Peloton and Shopify would be major additional beneficiaries. When the pandemic ends there is widespread views on how such companies will be impacted. On the one hand, many analysts believe some or all of these will experience a reduction in revenue against strong comps. Others, including myself, think that behavior has changed, so while massive growth experienced during the pandemic won’t be replicated, most, if not all of them will continue to grow at a more “normal” rate. The four advertising companies I mentioned previously: Facebook, Google, Pinterest and The Trade Desk have all been impacted by the loss of advertising from major business segments like travel, live events (and associated ticket sellers) and brick and mortar retail. Since Amazon advertising revenue is limited to online sellers it is not affected by loss of ads from these sectors. My expectation is that when the Shelter-in-Place requirements are substantially eased, all four of these companies will experience a jump in advertising revenue. As we reach April of 2021 this jump will be compared to depressed comps and all four should experience above normal growth.

Of companies that are in my 2020 stock pics, surprisingly, Tesla has appreciated well over 600% despite its revenue being lower than pre-pandemic expectations. I believe this is mostly because of the certain shift taking place towards software enabled electronic cars but the stock has also been helped by inclusion in the S&P index. The other company negatively impacted by the pandemic is Stitch Fix. On the one hand, it has undoubtedly gained share as it offers a modern online method of shopping to its very large base of customers, but it is also obvious that people are just not buying that many items of clothes during the pandemic. I expected Stitch Fix to be a substantial beneficiary when Shelter-in-Place is eased, but the market is already anticipating this as we’ve seen it’s begin year value of $25.66, which fell dramatically earlier in the pandemic, rebound nicely to a price of $69 in December 2020…a 170% appreciation year-to-date.

I have also been examining several companies that had recently IPO’d as younger public companies tend to have higher growth rates which in turn creates greater potential future appreciation. So, I considered the various companies that had come public in 2019 to see which ones met my screens. Investing in Lyft and Uber, post IPO, had little interest for me. On the positive side, Lyft revenue growth was 95% in Q1, 2019, but it had a negative contribution margin in 2018 and Q1 2019. Uber’s growth was a much lower 20% in Q1, but it appeared to have slightly better contribution margin than Lyft, possibly even as high as 5%. I expected Uber and Lyft to improve their contribution margin, but it is difficult to see either of them delivering a reasonable level of profitability in the near term as scaling revenue does not help profitability until contribution margin improves. So, I passed on both which proved the right decision as Lyft is still well below the first day’s closing price of $78.29 post-IPO. Uber is now up 27% vs its first day closing price (roughly the same as the S&P index) as food delivery has proven a great business for them during the pandemic. The first of the 2019 IPO class that I bought was Zoom Video, which had a contribution margin of roughly 25% coupled with over 100% revenue growth. It also seemed on the verge of moving to profitability. Four others piqued my interest: Pinterest, Peloton, Slack and CrowdStrike. All of these were growing revenue at a 40% or higher rate, had solid business models and met my other criteria. I’ll discuss these in more detail in my following posts but, on average, they are up well over 300% this year …stay tuned for my 2021 predictions!

Recap of 2023 Top Ten Predictions

Our predictions for 2023 were all fulfilled with the stock portion providing extremely strong performance. This was on the heels of poor performance in 2022 as it was one of the worst years in the past 50 for the stock market in general, and for my stocks in particular. In delineating the stock recommendations in our Top Ten predictions for 2023 we pointed out that the 6 stocks, on average had fallen nearly 49% in 2022 despite average revenue growth of about 38%. Since we expected all 6 to continue to grow in 2023 (and both Amazon and Shopify to increase their growth rates), we felt they were all poised for a recovery. This clearly proved accurate.

What went right for my stock picks in 2023 was great company results coupled with the benefit of an apparent end to the rate hike cycle. I have always pointed out that I am not amongst the best at forecasting the market as a whole but have been very strong at selecting great companies which over the long term (5 years or more) typically have solid stock appreciation if their operating performance is consistently good. But even great company’s stock performance can be heavily impacted in any given year by market conditions. Two key drivers of negative market conditions in 2022 were the huge spike in inflation coupled by the Fed raising rates to battle it.

At the beginning of 2023 we felt that inflation would be on the decline from its peak of 9.1% in June 2022 (see prediction 9). Given the expected decline in inflation we believed the Fed would slow and then stop increasing interest rates. Since the rise in interest rates was a major reason for the decline in our long-duration stocks, we believed that slowing and then stopping this rise would be a factor in driving elevated stock performance.

So, the big question for the market at the beginning of 2023 was whether the expected additional rate increases projected at just under 1% for the year (which theoretically was built into share prices at the end of 2022) would be enough for The Fed. It pretty much was as the Fed raised rates 1.0% during the year but stopped making increases after July and subsequently indicated that rates could start declining in 2024.

Stocks reacted well to what appears to be end of the upward climb in rates and tech stocks reacted particularly well as long duration investments tend to be influenced greatly by rate changes. Coupling this with what appears to be a soft landing created a positive environment for our recommended stocks.

Our six recommended stocks were up an average of 96% with 3 of the 6 appreciating over 100%. While we will have a longer discussion of the reasoning behind it in our next post, we wanted to disclose that all 6 will be recommendations in our 2024 Top Ten.

2023 Stock Recommendations

  1. Tesla will outperform the market (it closed 2022 at $123.18/share)

As usual, Tesla was a wild ride in 2023. Partly, this was based on continued controversy surrounding Elon especially his actions post his October 2022 purchase of Twitter (now called X). But in addition, concerns over price drops, potential slowing momentum of Battery Electric Vehicles, challenges to Tesla market share and more weighed on the stock at times. These concerns buried the stock in 2022. In 2023 they continued to be sighted by shorts but proved overblown as the company reached its unit sales target of 1.8 million vehicles (up 40%), launched the CyberTruck in Q4 and substantially increased its market share of overall vehicles sold. As a result, Tesla stock was very strong in 2023 and closed the year at $248.48/share, a rise of 102%.

2. CrowdStrike (Crwd) will outperform the market (it closed 2022 at $105.29/share)

The most recently reported quarter for CrowdStrike, Q3 FY24 was another strong one as the pandemic had little impact on its results. Revenue was up over 35% and earnings 105%. Existing customers continued to expand use of the company’s products driving Net Revenue Retention to exceed 120% for the 20th consecutive quarter. The company’s stock, which had declined nearly 50% in 2022 (despite a revenue increase of 54%), had a dramatic recovery. It closed 2023 at $255.17/share, up 142%.

3. Amazon will outperform the market (it closed 2022 at $84.00/share)

As we expected, Amazon improved revenue growth in each quarter of 2023 from its low point of 8.6% in Q4 2022. In Q3 2023 growth was back to 12.6%. Additionally, the company increased its focus on profitability with Q3 profits up well over 200% versus the prior year’s weak numbers. This coupled with the improved environment for tech stocks helped drive Amazon’s share price to $151.75 at year end, up 81% from the close on December 31, 2022.

4. The Trade Desk (TTD) will outperform the market (it closed 2022 at $44.83/share)

Fears of a potential recession caused great concern for advertising revenue. After dropping sequentially in Q4 2022 (to 24.1%) and again in Q1 2023 (to 21.5%) TTD’s revenue growth began recovering in Q2 (to 23.1%) and again in Q3 (to 27.7%). The stock reacted well to the improvement and closed 2023 at $71.80 up 60% from year end 2022.

5. Datadog will outperform the market (it closed 2022 at $73.50/share)

Like many other high growth subscription-based software companies, Datadog experienced another solid year in 2023 with Q3 revenue growth at 26.7%. Also, like CrowdStrike, Datadog has a very high gross margin (GM) and is now at the point where it has started to leverage its GM driving up earnings (+96%) at a much faster rate than revenue. This level of success helped Datadog stock close the year at $121.65/share, up 66%. 

6. Shopify (Shop) will outperform the market (it closed at $34.71/share)

In our post of Top Ten predictions, we pointed out that the pandemic had created a major warping of Shop revenue growth.  Instead of the normal decline for high growth companies from its 47% level in 2019 it jumped to 86% growth in 2020 and still was above “normal” at 57% in 2021. Once physical retail normalized in 2022, Shopify growth plunged against the elevated comps declining to a nadir of 16% in Q2, 2022. When we included Shop in our Top Ten for 2023, we pointed out that we expected its revenue growth to return to 20% or more throughout 2023. This indeed did occur and the stock reacted well, closing the year at $77.88 up 124% year/year.

Non-Stock Specific Predictions

While I usually have a wide spectrum of other predictions, last year I wanted to focus on some pressing issues for my 3 predictions that are in addition to the fun one. These issues are Covid, inflation and California’s ongoing drought. They have been dominating many people’s thoughts for the past 3 years or more.

7. The Warriors will improve in the second half of the current season and make the Playoffs

This forecast proved correct as I expected the Warriors to make the playoffs but be unsuccessful at winning a title. They did rally in the latter part of the season to finish 6th (avoiding the play-in) and won the series against the Kings but failed to progress to the Western Finals.

8. Desalination, the key to ending long term drought, will make progress in California

Some of the pressure to create desalination plants throughout California was reduced by substantial rainfall last year that ended the drought and filled reservoirs. Despite this there was progress as the California Coastal Commission approved a $140 million desalination plant in Orange County (at Dana point) in late 2022. Resistance to its construction has been mounted by environmental groups but in 2023 the planning continued to move forward.

In April 2023, the Department of Water Resources (DWR) announced 3 more projects that will receive support from DWR and an additional 6 projects that will receive funds through a partnership with the National Alliance for Water Innovation. While the total water generated through all projects currently approved is still far short of fulfilling California needs, the tide seems to have begun to turn (no pun meant) towards favoring use of desalination.

9. Inflation will continue to moderate in 2023

This forecast proved pretty accurate as inflation moderated to just over 3% in 2023 (very slightly higher than my projected range). It was at 6.3% when I made the forecast.

10. Covid’s Impact on society in the US will be close to zero by the end of 2023

I consider this prediction mostly right. On the positive side I believe Covid no longer has much influence on people venturing out to shop, dine, go to the theater, travel, etc. Even cruise lines are experiencing a substantial return towards normal. The number of new Covid cases has waned significantly and deaths from it are close to zero. However, I would not say we’re quite at zero impact as there are still some spikes (of modest magnitude versus before) that cause concern to a portion of the population.

EVs will dominate new car sales within 5-6 years

What does that mean for Tesla and others?

EVs include both BEVs (Battery Electric Vehicles) and PHEVs (Plug-In Hybrid Electric Vehicles). We’ll start with a top-down view and then go into substantial detail regarding Tesla followed by some overall discussion of Rivian and Lucid.

California is taking the lead in banning sales of new gas-powered cars by 2035.

In August 2021, President Biden issued an Executive Order setting a target that by 2030, 50% of all new vehicles sold in the US will be net zero emitters of greenhouse gasses. He has recently added a goal of 60% by 2032. California has drawn a line in the sand regarding legislating the end of gas-powered vehicles. A measure approved by the California Air Resources Board requires all new light vehicles (passenger cars, SUVs and pick-up trucks) sold in the state in 2035 or later to generate zero emissions. It is a little unclear whether this will allow PHEVs to be sold, as they do generate emissions, but my reading suggests that PHEV models that can be charged at a charging station are probably not currently part of the ban. I expect this to change and believe PHEVs will be banned as well or fall to minimum sales once the conditions for BEVs described below are met. Six other states have already followed California’s lead: Maryland, Massachusetts, New Jersey, New York, Oregon, and Washington. Numerous other states are in the process of considering moving in the same or an even more aggressive direction.

I believe that most of the country and the rest of the world will follow in this direction (unless lobbying efforts slow progress) as the following issues are already or likely to be met by 2030:

  1. BEVs must offer enough driving range to make buyers comfortable;
  2. BEVs with the right characteristics need to become more affordable;
  3. There must be close to the same access to charging stations as gas cars have to gas stations.

Driving Range on dozens of BEVs will likely exceed 500 miles by 2030.

For perspective consider that (according to Electrek) in 2012 there were only 9 EVs available, 8 of which were Hybrids that, on average, could only drive about 70 miles on the battery. The 9th was the Tesla Model S which had a range of 265 miles but cost about $90,000. As late as 2016, there was still only one pure BEV with a driving range of over 300 miles, the Tesla Model S. By 2021, this number had expanded to 5, 3 of which were Tesla models. As of August 2023, there are 14 models with that range including 4 from Tesla, 2 from Rivian and one from Lucid. Lucid has the longest range, 520 miles, but the two Rivians and the Tesla Model S Long Range all are over 400 miles. The list includes 2 models from Ford, two from BMW, plus one each from Mercedes, Kia and Hyundai. What this suggests is that further increases in driving range are not only possible but extremely likely (in fact preliminary reports indicate the next version of the Tesla Model 3 due in 2024 will move to over 400 miles of driving range). I believe that in 7 years, or even sooner, there will be numerous models that have a range of over 500 miles, including all Tesla models, all Rivians and all Lucids. This is a technology issue and as we’ve seen with computers and phones, technology delivers better performance every year.

Affordability is already here…sort of!

The standard Model 3 is listed on Tesla’s website as having a manufacturers suggested retail price of $32,740 after the federal EV tax credit. But California also provides a state tax credit of $7500. After that credit the price drops to $25,240, $1,000 less than a gas-powered Toyota Camry. That doesn’t even consider the lower cost of service and fuel, or the higher resale value of the Tesla. This has led to the Model 3 replacing the Camry as the best-selling car in California, This depends on tax credits so we’re not quite at parity yet on affordability but given the trend we should be in several years.

Charging availability is increasing rapidly.

According to the Department of Energy, the number of charging stations in the US increased from 5,070 in 2011 to 143,711 at the end of 2022. This represents a compound annual growth rate of about 35.5%. The stations have also improved in their speed to charge. It is also easy to install a power line at home to be able to charge the vehicle every night, eliminating the need to use a charging station other than for long trips. Gas powered cars do not offer this convenience. For example, my wife and I recently went from our home in Atherton to Napa for a weekend, a distance of about 90 miles each way. In total, including visiting wineries and restaurants, we drove 340 miles. We never charged the car during the trip as her Tesla’s range is over 400 miles. There are currently over 145,000 gas stations in the US. The number of locations with charging stations now exceeds 54,000. At the historic  growth rate of over 35% this would mean that the number of charging locations could exceed the number of gas stations by the end of 2026. It is also likely that the number of gas stations could decline as the install base of gas-powered vehicles declines.

Sales of BEVs have reached an inflection point.

In 2022 worldwide sales of light vehicles (passenger cars, SUVs and pickup trucks) EVs reached over 10.5 million units, up 55% year/year. This occurred despite the sales of all light vehicles declining slightly versus 2021.

To understand where this is going, we initially need to produce a forecast for total light vehicle unit sales (which, for simplicity we’ll refer to as “cars”) in 2030. I have assumed that by 2026 global unit sales would return to 2018 levels which was 93.7 million according to IHS Markit. I then assumed the volume would grow by 2% per year through 2030. Some would argue that given population growth, matching 2018 volumes 3 years from now is too conservative. Others will say we will not get back to that level. I believe this to be a middle of the road assumption.

The second question is what share will BEVs be of total auto sales? In the table below I show a range that varies from 30% to 70% (BEVs are over 10% in 2023). If we apply the Biden 50% minimum goal for the US to worldwide sales, then the 2030 number would be 50% of 101.4 million units or 50.7 million units. This would mean an 8-year compound growth rate of 26.6% for unit sales of BEVs (it grew about 60% in 2022). Obviously, this is not an exact science!

I expect Tesla unit sales to be about 8X 2022 levels in 2030.

In 2022 Tesla sold over 1.3 million BEV autos which was 17.1% of the BEV market. That is far from the full story as they did not participate in several large categories of vehicles: pickup trucks, low-cost autos, and sports cars. Their share was over 30% in the categories they did participate in. I believe that by 2030 Tesla will have added all three of these categories to its lineup. If we take the middle row and column of the above chart: BEVs have 50% market share and Tesla sells 20% of BEVs (which is 1/3 share lower than they currently have in categories in which they participate). That would mean Tesla will sell 10.14 million vehicles in 2030. If they did, the company would have an 8-year CAGR of 29%. This is well below the 50% growth they are tracking towards this year but of course the law of large numbers predicts a decline in high growth rates.  

Tesla Stock did not reflect strong expectations in 2022.

Despite revenue growth of over 50%, Tesla was one of the worst stocks in 2022. Partly this was due to fears that Elon’s acquisition of Twitter would be a distraction, partly it was due to the backlog shrinking and partly it was due to Elon liquidating a number of shares to finance the Twitter acquisition. In H1 2023 Tesla was one of the best stocks in the market (appreciating over 110%) as the backlog began to (slightly) expand again, Elon stopped selling shares (and promised to hold his position for the rest of 2023) and the Twitter acquisition became less of an issue to investors. It should be noted that as of September 10, Tesla shares have slipped by about 5% from the June 30 value over new fears that Tesla price cuts were hurting earnings. It was obvious to us that the price cuts were to leverage superior manufacturing cost and drive increased volume and this has in fact occurred, but Tesla will remain a volatile stock which is why premiums on Tesla calls are quite high.

Unlike some, we believe Tesla was smart to raise prices substantially in 2021 and 2022 while they could not meet demand. Then we believe they were smart to lower prices once their manufacturing capacity expanded, and backlog shrunk to a more normal level. Lowering prices places tremendous stress on the competition as Tesla has significant margin advantages over its competitors. Its net margins are still strong at lower prices, but many competitors don’t have the room to maintain margins at lower prices. Additionally, lowering prices on Tesla mass market vehicles meant that many Model Ys and Model 3s qualified for the US $7500 tax credit for electric vehicles that started on January 1, 2023. Nonetheless, the level of price decreases is worth monitoring as it does lower Tesla gross margins.

We expect Tesla unit sales to increase 45% to 55% in 2023.

Despite rising slightly in H1, the decrease in the Tesla backlog remains a concern to investors. At year end it was at about 44 days of production (or roughly ½ of units sold in Q4). While there are many elements to consider, some investors have a concern that it will be difficult for Tesla to achieve or exceed its target of 40% vehicle sales unit growth in 2023. Given already announced sales in Q2, Tesla unit sales were up 60% in H1. However, this includes a very weak comp in Q2 2022 due to China being closed for part of Q2 last year. Still if the company merely replicates Q2 sales in Q3 and Q4 for existing vehicles and adds sales of the Cybertruck to this total, 2023 growth would exceed 45%. There are several factors that indicate they are likely to continue to increase sales sequentially:

  1. In Q2 Tesla actually shipped more cars than it produced despite increasing production, while backlog remained relatively stable. 
  2. Historically Tesla has seen demand increase sequentially in virtually every quarter. If we assume a 7% increase going forward, then units will be up over 50% year over year in 2023 without any Cybertruck sales.
  3. The Tesla CyberTruck has a waitlist that exceeds 1.5 million vehicles. On August 16 Electrek reported that “truckloads” of Cybertrucks were spotted being delivered. These would not be for consumers but rather for final testing. Tesla has indicated that it will be hosting a launch date for the vehicle and speculation is that it will be quite soon. They then will begin building towards volume production starting in Q4. If existing product sales fall short of the 7% sequential increase in Q3 and Q4, sales of the CyberTruck could make up for the difference as these sales will be incremental to the current run rate for existing vehicles.
  4. The company now has the manufacturing capacity to increase volumes – the question will be parts supply and whether demand will be strong if the economy goes into a recession.

Despite a reduction in its backlog in 2022, demand for its vehicles continues to increase. As you hear of new competition in the electric vehicle market keep in mind that Tesla share of the US market for ALL cars is still only about 3% and in China and Europe it remains under 2%. As a comparison Toyota worldwide market share is over 13% and VW is not far behind. We estimate that Tesla’s share of BEVs in the categories it plays in is over 30%. Once it launches the Cybertruck it will increase its available market (TAM) substantially. But it will still need to launch a low-priced vehicle (in the $25,000 – $30,000 range) and a sports car (which it is working on) over the next 3-5 years to address the total market. As the world transitions to electric vehicles, we expect Tesla’s share of all auto sales to rise substantially even as it declines in dominance of the electric vehicle market. When the CyberTruck begins shipping, Tesla total backlog is likely to increase to over 1.6 million vehicles. And the CyberTruck current backlog isn’t expected to be fulfilled until late 2027! 

Tesla Margins

Tesla gross margins declined in Q1, as price decreases had an impact. In Q2 Tesla made further price decreases but this was partially offset by improved efficiency in newly launched factories in Berlin and Texas. While lower vehicle prices in 2023 and increasing cost of parts will place some pressure on gross margins, we still believe they will continue to remain by far the highest of any auto manufacturer:

  • Tesla, like Apple did for phones, is increasing the high margin software and subscription components of sales;
  • Add-on sales are likely to offset a portion of price decreases;
  • As its new factories ramp they will increase their efficiency; and
  • Tesla will have lower shipping cost to European buyers as the new Berlin factory reaches volume production.
  • A decline in gross margins can be at least partly offset by SG&A declining as a percentage of sales as revenue growth is likely to be higher than any increase in SG&A.

Revenue in the Semi category could surpass $10 billion in a few years.

To date the Tesla Semi has been produced in very small volumes and limited production capacity will mean deliveries will remain low during the next few quarters. We believe the ramping of Semi production will begin in late 2024 as the company only has a small number in customers’ hands today (essentially for test purposes). However, given its superior cost per mile the Semi is likely to become a major factor in the industry. Despite its price starting at $150,000, its cost per mile appears lower than any competitive products. Given potential of up to $40,000 in US government incentives the competitive advantage over diesels will be even greater. The company is expecting to increase production to about 50,000 per year by some time in 2025 (which would represent potential incremental high margin annual sales in the $8-$10 billion range). While this is ambitious, the demand could exceed that as it represents a single digit percent of the worldwide market for a product that should have the lowest cost/mile of any in the semi category.

Tesla Expects to launch a new Roadster in 2024

The new version of the roadster is being developed but it’s unclear when it will be ready for production as the target date has slipped multiple times. Right now, Tesla expects the launch to be in 2024. Once it launches, it will become another source of incremental demand at high margins. The early claims are that it will have a driving range of over 600 miles (at reasonable speeds), a top speed of 250 miles/hour, go zero to 60 in 1.9 seconds and cost about $200,000 for the standard model. This would make it faster than a McLaren.

The Bottom Line: Tesla should continue to have accelerated revenue growth in Autos.

This all points to solid revenue growth continuing (but at a lower level than unit sales growth in 2023), strong GMs in 2023 and beyond, and earnings escalation likely faster than gross margin dollar growth. While the company has reduced pricing, the ability to sell greater dollars in software should help maintain strong AOV and gross margins.

Tesla is not a one trick pony – it has several other potentially large revenue streams.

There are numerous other revenue sources for Tesla, especially on the energy side given its strong solar offerings and best-in-class power walls. Tesla also is a leader in automated driving and should that reach commercialization for “driverless taxis/driver services” the company is well positioned to add a substantial revenue stream. The discussion above regarding charging stations did not include the fact that Tesla is the runaway leader in this category (it just reached 50,000 units deployed) and its technology is probably going to become the standard. So, while I believe the vast majority of charging will take place in the home, Tesla will add another revenue stream from their infrastructure. Recently GM, Ford and Rivian have all decided to move to the Tesla charging technology.

Finally, there is some possibility that Tesla’s Optima Robot project will, at some point in the future, lead to launching smart robots that can perform numerous tasks. The company has taken its AI developed for autos as well as the variety of sensors integrated into a vehicle and transformed them to apply to robotics. At their AI day 11 months ago, they were able to demonstrate a humanoid alpha version that could walk with knowledge of what was in front of it and around it. The robot could also pick up objects and perform other simple tasks. We expect a significant leap forward at this year’s AI day scheduled for September 30. Elon, who tends towards optimistic thinking, has stated that he believes revenue from the Optima could exceed Auto revenue at some point in time!

A few comments on Rivian.

Rivian has gotten quite a bit of press regarding its opportunity to be one of the leaders in BEV pickup trucks and SUVs. The Rivian R1T electric pickup truck has recently earned the J.D. Power award for the most satisfying experience among BEVs (Tesla was second). The study, released in February, benchmarked EV owner satisfaction with critical attributes that affect the EV ownership experience. Reviewing 2022 and 2023 model year battery electric and plug-in hybrid vehicles, EV owners found R1T to be best among premium battery electric vehicles for driving enjoyment, vehicle quality and reliability, service experience, interior/exterior styling, cost of ownership, ease of charging at home and accuracy of stated battery range.

Cars.com reviews gave Rivian a 5.0 out of 5.0 rating with 100% of customers saying they would recommend it. A second review site, Edmunds, with a minimal number of reviews, was less favorable as most reviewers rated it highly, but several reviewers liked the vehicle but were dissatisfied with the quality of service. We believe the JD Power survey to be the most reliable. The strong customer experience positions the company for accelerated top line growth. In Q2 revenue was up over 200% year/year and unit sales increased 59% sequentially. Rivian also increased their guidance of how many vehicles they will ship this year to 52,000. Despite the Ford F150 pickup being touted as the clear leader in the category, CNBC reported that Rivian actually sold more electric pickup trucks in the US in H1 than anyone else. In a recent survey by Car Guru, 43% of potential truck buyers said they favored buying an electric vehicle.

Rivian also has an order to build 100,000 electric vans for Amazon. Amazon says it has taken delivery of 5,000 already and I have recently seen a few on the road in the SF Bay Area. I asked the driver of one what she thought of the product. Her reply was that it was quite an improvement versus her prior van. In searching for other products that compete there appear to be numerous others manufacturing this type of product. It’s hard to tell if the Rivian van has an overall advantage but it does seem to have the longest range of any that I found. This appears to be a very large opportunity for Rivian as the price of its vans start at $60,000 so the existing Amazon order is worth at least $6 billion (5.4X Q2 Rivian revenue) and Amazon could decide to expand the order. The fact that its competitors does not include Tesla puts Rivian in a strong position.

Given the quality of its vehicles, Rivian is well positioned to scale if they can fix their economics. In Q2 gross margins on its vehicles improved by $35,000/vehicle over a year earlier but still came in at a loss of $412 million. If the company can move to profitability (a target it expects to reach in late 2024) without compromising vehicle quality, it could be a very strong performing stock. The risk that they don’t get there before running out of cash has kept the stock value low.

Lucid appears to be struggling.

Lucid produces a very high-end electric sedan that directly competes with the Tesla Model S. The Lucid Air is more luxurious and has a longer driving range than the Tesla but also costs more. The product gets great reviews from magazines like Car & Driver who said: “ As luxury electric sedans go, the Air is a home run, delivering a posh overall experience with an unbeatable driving range.” Given such accolades many thought the Air would be a worthy competitor to Tesla. However, consumers have not embraced the product as their reviews are just OK. Cars.com reviewers gave it an average rating of 3.3 out of 5 and only 46% of those reviewed said they would recommend it. As a comparison the Tesla Model S received a 4.0 average rating and 80% of reviewers said they would recommend the car. Admittedly, the number of reviews was small, but this is still an issue for Lucid.

Lucid appears to have lost momentum in the marketplace as Q2 sales of 1,404 units were flat compared to Q1 and fell well short of Wall Street expectations of 2,000 units. This also put into question whether Lucid was successfully converting the 28,000 reservations it had previously disclosed.

On the positive side, Lucid is extremely well funded and struck two interesting deals in the quarter:

  1. To supply Aston Martin with power trains, battery systems and related technology in a deal worth $232 million.
  2. To begin sending cars to Saudi Arabia which may help relieve the company’s inventory build up as it produced over 1,700 more vehicles than it sold in H1.

Both deals must be taken with a grain of salt as the Saudi Arabia Public Investment Fund is a major backer of both Lucid and Aston Martin.

Lucid will be launching new lower priced vehicles going forward so it still remains a company with potential given its ample capital, quality technology and well-designed vehicle. But, unlike Rivian which has carved out a niche where Tesla is not a direct competitor (now or in the near future), Lucid will have to find a way to be more successful versus this dynamo.

A Counter Theory to Potential Recession (during week 26 of Shelter in Place)

Consumers have more money available to spend – not less

Much of the public dialogue concerning the economic effect of Covid19 has centered around the large number of people who have lost income, with the conclusion that the US will potentially experience a continued recession going forward. What seems to be lost in the discussion is that the 90% of the labor force that is employed is saving money at an unprecedented rate. This has occurred partly through fear of future loss of income but mostly by a reduction in spending caused by the virus. For myself and my family, our spending has been involuntarily reduced in the following areas:

  1. Personal care: haircuts, beauty parlor, nail treatments, massages, etc.
  2. Cleaning services: we are wearing very casual clothes that get washed instead of going to the cleaner (who has mostly been unavailable anyway).
  3. Vacations: our last vacation was in December. We haven’t been on a plane since the pandemic started and cancelled two vacation trips.
  4. Purchasing clothes: I have bought some items online for future use (because they were at major discounts) but being at home means I don’t really need any new clothes.
  5. Restaurants: before the pandemic I was eating breakfast and lunch out every weekday at or near my office and my wife and I ate out lunch and dinner on weekends. Additionally, I normally have additional business dinners several times a month. Instead, we are ordering food in on weekends from local restaurants we wish to support, but the cost is much lower than when we ate at the restaurant. Many of the people we know haven’t even ordered in from a restaurant.
  6. Transportation: these expenses have been virtually eliminated as I am not commuting to my office, take no Ubers and rarely drive anywhere other than to pick up local takeout food.
  7. Entertainment: such expenses have been close to eliminated other than occasionally purchasing a movie for home consumption.
  8. Medical/Dental/Optical Services: In my case medical and dental expenses have remained the same but many others have seen them reduced as access to doctors and dentists has been curtailed.

The only expenses that have increased are paying for delivery of food instead of picking it up ourselves at a supermarket and our new Zoom subscription…but at $12/month that hardly counts. I believe my family is representative of the 90% of people who still have their jobs at no reduction of pay.  In fact, according to Statista, the savings rate in March through June increased to an average of 22% versus 7.9% in 2019. Using this data, I estimate that by the end of August this amounted to approximately $1.2 trillion in above normal savings as compared to last year’s “normal” savings rate. Since stay at home is unlikely to end in many places by the end of August, this number is likely to grow.

Post Pandemic: will some areas of savings persist?

Survey data of companies indicates that there is likely to be an increase in the number of people who work from home once the pandemic ends A recent survey by Global Workplace Analytics estimates that the U.S. will see between 25-30% of the workforce working from home multiple days a week by the end of 2021, up from less than 5% who were working from home at least half-time or more before the pandemic. Since working from home will continue to offer some savings in spending this could add to the “pot” of available dollars to be redeployed. There also may be some people who remain reluctant to fly or go on a cruise. We don’t expect these incremental cost savings to be removed from commerce but rather to be redeployed.

What I believe will occur post-pandemic

While some people will take advantage of their lower cost during the pandemic to pad their savings, it seems likely to me that a substantial portion of the “above normal” accumulated savings will be spent. I believe that such spending will be divided between satisfying pent up demand for items like clothing and vacations and new demand for luxury items. The pent-up demand will start with numerous parties as people are able to once again have human contact, but it also is likely to consist of increased purchases of clothes, more visits to restaurants and rescheduling of missed vacations.

I think that some portion of these savings will also be used on furniture (and perhaps even full remodels), art, and increased purchases of luxury items. After all, people can easily feel they deserve a reward for all these months of suffering. It is apparent that many people are already adding to their online budgets for furniture, décor and art as Wayfair has seen a large spike in revenue. While Wayfair results may be due to increased marketing spend, Azure portfolio company Chairish, has also had a very large spike in revenue without such an increase in marketing.

Has the pandemic caused temporary changes in buying habits or merely accelerated trends that were already in place?

The pandemic caused a number of radical changes in behavior, including:

  1. Most people working from home and rarely, if ever, going to their office.
  2. The vast majority of people ordering almost everything online instead of visiting a store.
  3. Shifting to video calls with coworkers, friends and relatives as opposed to regular phone calls or face to face interactions.
  4. Working out at home instead of at a gym, where possible.
  5. Education moving to at home via Zoom.

These shifts favored eCommerce sites, delivery services, providers of video conferencing, home equipment providers, Telemedicine, web services providers, and many others. They devastated physical stores, especially large department stores, restaurants, local transportation services (like subway systems, busses, ride services), service providers like cleaners, beauty parlors, spas, and gyms, airlines, hotels, theaters and arenas, and sports leagues (including college sports). There was also a lesser negative secondary impact on the advertising and marketing sectors as companies with major demand losses curtailed their spend.

How Ya Gonna Keep ‘em Down on the Farm After They’ve Seen Paree?

This was a song in the aftermath of World War I highlighting the fact that farm boys, once experiencing a more sophisticated life and culture would find it hard to return to their old way of life. It could not be more appropriate for the current situation. The leap in how much nearly everyone in society is using eCommerce, video conferencing, schooling and working at home is accelerating trends that were already in place. In fact, for me:

  • Phone calls to friends that used to be audio calls are often Zoom video calls;
  • While my wife and I already were buying a great deal online, its now pretty much everything and when the pandemic ends our portion of purchases online will remain at an elevated level given the convenience and the availability of a larger choice of items
  • While I already had a home gym, many others are now substituting this for a gym membership
  • In the 25+ weeks I’ve been “sheltering in place” I visited my Menlo office for 2-3 hours on about 5 separate occasions. While I look forward to more in person meetings once we are back to normal, working at home is an option that I expect to continue to use with some frequency once the pandemic ends. I also believe that several Azure portfolio companies can reduce the number of in-person board meetings by alternating them with Zoom board meetings.

I honestly find it hard to believe that our society will not shift behavior in the same way as my wife, myself and companies in the Azure portfolio. After all, while most of us have suffered from lack of interaction with others, the pandemic has introduced many shifts that people find positive. With this, and keeping the larger available funds mentioned earlier in mind, here are some of my post pandemic predictions:

  1. Ecommerce share of the consumer wallet will be much higher than before Covid, but not as high as currently.
  2. Consumer spending for the near term will grow to a much larger amount than pre-pandemic days (by perhaps as much as 15-20%).
  3. Online Advertising Companies will have a banner year in 2021 as Ad spending resumes for industries that were impacted by Stay at Home. These include airlines, cruise lines, hotels, live events (sports, concerts, etc.), ticket sellers, physical retailers. As their spend resumes, players like Facebook, Google, Pinterest, Twitter and Snapchat will have elevated revenue versus comps from the depressed 2020 numbers.
  4. Video calls will INCREASE SHARE even compared to during the pandemic as the people who have experienced its benefits will find it hard to go back to plain audio, companies will see the economics of reducing travel by increasing the number of video meetings and about 25-30% of the workforce will continue to spend 2 or more days working at home. Additionally, companies will be more comfortable hiring IT staff in less expensive locations as they have seen the effectiveness of video vs in-person communication, and some colleges that previously only offered in-person education will augment their income by adding students that are taught remotely using video conferencing.
  5. Home remodels will have a renaissance from simply buying a new couch to completely redoing rooms or even the entire house.
  6. Suburban homes will increase in value (this appears to be already happening) as people value having outside space in case of a pandemic recurrence.
  7. Working from home will be at an elevated level vs pre-Covid but demand for office space will resume as workplaces will require more space per employee.
  8. More shopping malls will close as Big Box retailers close more stores (or in some cases cease to exist).
  9. The ability to sign and even notarize documents using the web will continue to see high growth in demand
  10. Vacations will resume, but for about a year or more there will be an increase in driving vacations
  11. More people than pre-Covid will take to wearing masks on a regular basis
  12. There will be a one year above normal bump in purchasing of luxury items like more expensive cars, expensive watches, new state of the art TVs

The Stock Market is already at Least Partly Discounting a Number of the Above Items

Many have been surprised at the resilience of the stock market during this crisis. It is important to remember that the Market discounts future results rather than past ones. So, I believe, many investors are looking at some of the above and factoring it into how to value stocks. The trickier issues involve stocks that have been beneficiaries of the pandemic but I’ll leave that for another time.

Soundbytes

  • In our January post of the top ten for the year we included Zoom as a stock buy in 2 ways. One was to simply buy the stock and the other was to buy the stock and sell both calls and puts. By June 30 the stock was at $253.54 per share and the call options (with a strike price of $80) was at $175 per share. Since the option premium was down to sub $2, I would have bought back the stock and the call options as there was little benefit to letting them ride as the IRR could not increase. But since I didn’t publish that then we can just assume I did that on September 1 where the premium was down to about $0.50. I can also buy back the puts at $0.40. That would mean I initially spent a net of $50.70 and received back $79.10, 8 months later. This translates to an annualized IRR of about 100% (on June 30 it would have been over 120%). Make no mistake, if you bought the stock and did not sell calls, I would continue to hold it as I expect another very strong (above analyst consensus forecast) quarter in Q3 which will be reported in early December.

Week Seven of Sheltering in Place

As hard as it would have been to believe back in the olden days (like in February) my wife and I are now in the 7th week of “Sheltering in Place” and it has just been extended another 4 weeks. The questions constantly being discussed among my colleagues, friends and family are:

  1. How long will this last?
  2. What will life be like at the beginning of the end of this initiative?
  3. When will things go back to normal?
  4. Who will the Warriors draft with their high pick this year (OK not everyone brings this one up)?

I’m not going to try to answer any of these as I’m sure you are all bombarded with potential answers and there are many who know more than I do regarding a pandemic. In this post I’ll try to grapple with 3 different questions, each of which deserves a section below.

Question 1: How will the long-term ramifications of Covid-19 impact success for companies and what can they do to enhance their opportunity?

This is a long-winded question and will get a long-winded answer. To begin, I believe this will only accelerate several trends that are already in place: online commerce gaining share, the use of video conferencing and the virtual workplace, as well as increased emphasis of companies being economically efficient. The pandemic has forced most people to be much more cautious at venturing out to accomplish such everyday tasks as shopping, eating in restaurants and going to the movies. Instead, they are learning that almost everything can be bought online (including food from some top restaurants), conferencing with Zoom provides a great experience at a low cost, and business efficiency will be correlated with survival.

My wife and I have long been online shoppers but as we shelter at home, we have increased the volume of purchases quite significantly. Department stores that were previously experiencing loss of share to online merchants but were resistant to devoting sufficient effort to their own online stores are in deep trouble. It appears likely that a number of well-known and not so well-known retailers will file for bankruptcy within the next few months. The combination of people becoming more comfortable with buying just about everything online and a major reduction in the number of physical outlets will open up more share for online players and for the online stores of multi-channel merchants.

During the current environment my board meetings (as well as everyone else’s) are being held as Zoom conference calls. For many companies, having such a meeting eliminates travel and hotel expenses for employees, board members and advisors. Replacing this with a Zoom conference call can mean lowering the cost to hundreds of dollars, from tens to hundreds of thousands of dollars, per meeting. While I am a big fan of the value of face to face, many companies will be re-evaluating whether having more of their meetings through video conferencing makes sense in an era when the technology has emerged as very viable and extremely cost effective. I’m not suggesting that all board meeting will be executed as video conference calls as face-face remains important, but perhaps companies will decide to do half of their meetings as a Zoom call. An interesting example is the NFL draft, where it was conducted through use of Zoom instead of renting a large stadium and paying for  travel expenses. Reviews have suggested that it was actually a better event than the prior year. I suspect the cost savings between all parties involved ran into the millions of dollars.

For many companies the pandemic has weakened revenue, putting pressure on survival. The government “bailout” PPP program helps, but by itself can prove insufficient to prop up companies with weak business models unless they have a very large cash reserve. The investment community was already shifting to focus more on efficient business models prior to Covid-19 but its disruption has helped to highlight the importance of building a profitable business.

Question 2: What should Companies do in the current environment?

What Azure has been suggesting for its portfolio companies is the following series of steps:

  1. If you are eligible, apply for government assistance through the PPP, SBA emergency loan or other programs.
  2. Create multiple models for your business under different scenarios (different dates that people will be back to normal, whether consumer spending will be reduced even after being back, whether customers will delay payments, etc.)
  3. If one or more of credible scenarios indicate that you will run out of cash, then cut costs as quickly as possible. For employees making over $100,000 per year (including founders) cutting them back to some amount that is still at $100,000 or more will have no impact on the forgiveness offered on the PPP loan.
  4. Make every attempt to extend any bank lines coming due as banks have been asked to cooperate with their customers.
  5. If you can afford it, be as kind as possible to your customers by extending terms, etc. Not all, but many, will remember your help and repay you with increased loyalty.
  6. While advertising seems an easy area to cut costs, make sure you evaluate the payback period for customer acquisition marketing as costs may be lower and online conversion may be higher (we have seen that with a number of our companies). In fact, if the payback is reasonably quick it may pay to play offense by being aggressive!
  7. If you have a strong cash position it may be a time to consider acquisitions as many companies will be struggling.
  8. If you have a product that customers are opting to purchase in this environment, think about trying to convert as many as possible to a subscription so that you can extend the relationship beyond the current situation. This can be done by offering attractive discounts for signing up for one or more years rather than month to month. For example, Zoom offers 2 months free if you opt for an annual plan versus a monthly plan. My wife and I decided the cost savings made it worth signing up for a full year.

Question 3: Who are the current and longer-term winners and losers as a result of Covid-19?

Winners

The biggest winners appear to be those that can leverage working at home, educating at home, buying at home, supplying infrastructure for increased online usage, and supplying products for increased cleanliness of surfaces and one’s self. In the public markets, I fortunately have 3 of my annual Blog recommendations included in these categories:

  • Zoom is the most obvious example of a beneficiary of people working and educating at home. It has reported that daily usage is up an astounding 30X between December and April. Its stock performance is just as astounding, up well over 100% year to date from the time of my pick in early January. The question for the company is whether they can harness this to make us permanently change how we communicate. For my wife and I, the number of Zoom calls we are on is now running between 5 and 10 per week. When I add my business calls the number is quite a bit higher. As they say: “How ya gonna keep ’em down on the farm after they’ve seen Paree?” That is, we are permanent customers as are many of our friends and colleagues.


  • DocuSign is another of my blog picks that should benefit in both the near term and longer term from the impact of the virus and sheltering at home. Its stock reflects higher expectation as it has increased in value by 41% year-to-date. If more meetings are going to be virtual then more documents will require esignatures and DocuSign is the runaway leader in the category


  • There are many other pure play beneficiaries of a future where more people entertain themselves, work and educate at home. This includes Netflix (stock up over 25%) who has seen a large spike in usage, Slack (stock up 30% since January 27), and online educational plays (our former company Education.com has seen a large spike in traffic and revenue as has our existing portfolio company Showbie)


  • Amazon is the poster child for purchasing online. It has announced hiring of 175,000 employees for increased warehouse and logistics operations which Wall Street interpreted as a massive increase in demand driving the stock to new highs (its currently up over 25% YTD). It should also benefit from increased purchases of eBooks and increased online usage of its Web Services (I haven’t seen much chatter about AWS benefit but it should be very large and is highly profitable). Azure portfolio company, Open Road is seeing a significant increase in its sales of eBooks since sheltering-at-home began.


  • Infrastructure Companies whose revenue varies with web usage should also benefit as volumes are increasing massively: Zoom announced that daily usage is up 3,000%; many others I’ve heard have ranged from 50% to 700% or more. Schools are converting to online classes with student usage increasing to 4-7 hours per day. Gaming companies are also beneficiaries and users. I believe that total web traffic is up at least 50% and perhaps a lot more versus where it would have been.


  • Clorox is one of the major beneficiaries of our new emphasis on cleanliness through disinfecting our environment and washing our hands many times a day, as recommended by the new folk hero Dr. Fauci. While its stock is up 20% year-to-date, the question is whether the increased demand for disinfectants is a permanent change. I’m guessing that increased usage is permanent… but not to the extent we are seeing today.

Long-Term Losers

Losers span several industries and the question for many of the companies in these industries is how permanent the loss of demand will be. Let’s look at them sector by sector.

  • Department Stores are currently shut down in most of the United States. Companies already struggling are now experiencing substantial losses every week. Those that have a pharmacy or grocery area (like Walmart) can stay open, but the real key to reducing the losses is the effectiveness of their online offering. In most cases this is pretty weak, both in percentage of the retailer’s sales and the level of profitability given inefficient distribution and high levels of returns. I expect multiple brand name players to file for bankruptcy before the year is over.


  • The Travel Industry is being hit very hard by the shelter-in-place requirements. Airlines are flying planes that are nearly empty but trying to maintain their cash by not cancelling flights until close to the date of departure so that passengers cancelling will get credits rather than rebates. One hotel I spoke to when cancelling my reservation told me that occupancy was down 90%. Many have already closed their properties. While I expect business to improve greatly for both of these arenas when we are back to normal, they are both accumulating massive losses which might pressure viability. Further, when we are back to normal (whatever that becomes) I suspect that airline traffic will be down through at least mid-2021 as fears are elevated and will take some time to subside. Cruise lines may be in worse shape as the publicity around the various ships that had large portions of passengers and crew get Covid-19 has definitely caused many to reconsider vacationing this way. I expect this sector to be impacted at least through the end of 2021. Also, cruises have had to refund most fares as opposed to providing a credit for future travel.


  • Arena Entertainment providers and entertainers have been hurt badly by the closure of their venues during this time period. This includes movie theaters as well as complexes like the Chase Center and other arenas. The question becomes when will they be able to be open for full occupancy? And when they are will people stay away for some time. I expect many of them to be at full occupancy by early 2021 as younger people (who make up the majority who attend concerts) will drive renewal of demand for concerts.

Short-term Losers that can Return to Success

  • Advertising Platforms (TV, Web, etc) have seen demand drop as the travel industry, live events and brick and mortar retailers have little reason to maintain prior spending. Additionally, those companies looking to cut cost view advertising (especially brand building advertising) as a prime candidate for cuts. However, I believe that demand will return to normal as stores reopen and travel is permitted. As of now this appears to be sometime in Q3. While many companies in sectors that take longer to return to normal will still have reduced budgets, online players will likely increase spend, as will those seeing this as an opportunity to gain share.


  • The Sports Industry consists of teams, leagues, arenas, ticket sellers (like Stubhub), equipment providers and betting. All of these are experiencing close to zero revenue (with the exception of some equipment being sold for home use). Leagues (and teams) with large TV contracts are likely to reinitiate games without live audiences by July as participants can be restricted to those having tested for no virus immediately before a game. Even without an audience the TV money will make this profitable to do. Once these are back in play, betting will resume. Equipment providers can still sell T-shirts and other paraphernalia online, but once games resume their sales will increase. By as early as the fall, but no later than early 2021, I expect that many states will allow live audiences for games and that arenas will be back to normal capacity for them. This would allow ticket sellers and sports betting to be at normal capacity. Equipment suppliers also depend on school purchases as well as little league, etc. So, while revenue will begin growing in the fall it may not be back to normal before early 2021.  A noted exception will be providers of at home equipment, like Peloton, which will lose business from gyms in the short run but should see a large increase in at-home purchases.


  • Non-Internet Service Providers (other than delivery services) have a particularly hard time as physical services cannot be provided online. Things like the Geek Squad, physician checkups and procedures, elective surgeries, automotive services, personal care like haircuts and manicures, massages, and more have been suspended. But as long as the entities survive this period, I believe there will be no permanent impairment of their businesses.


Conclusion

Coming back to where this post began, I’m still wondering who the Warriors will draft! But more importantly, I hope all of you and your families are safe and healthy. We will get through this!

Random Thoughts as I Shelter in Place

This post will be more of a stream of consciousness rather than one of focus on a topic.

Sheltering in Place

My wife, Michelle, and I have obeyed the order to “shelter in place” by staying at home except for walks outside (avoiding going within 6 feet of anyone). The order started in San Mateo County at 12:01 AM on March 17.  Our last time being in close proximity with anyone was Friday March 13, so we’re getting close to knowing we are virus free. We stocked up on food a day before the order began and have already had one “Instacart” delivery as well. Not sure what you are all doing but we have called a number of family members and friends to make sure they are ok – times like this make you want to verify the health of others! We also had to cancel vacation plans – which happened in steps as fear of the virus increased. We had scheduled a trip that included visiting Cabo followed by some time with good friends/cousins in Arizona.

I was scheduled to have my annual checkup before the trip, but 2 days before my doctor called to tell me not to come. It seems that the building he is located in is a center for virus testing and he thought it made no sense to have unneeded exposure. During the course of the conversation I mentioned we would be leaving for Cabo on Thursday, March 19 and he immediately warned me not to go. While I don’t want to be compared to the premier of Italy who initially told people to ignore the risk, at the time I felt the risk was overblown (as long as I was careful in Cabo). My doctor made an impossible to refute point saying: “What if you couldn’t get back because of a lockdown. Wouldn’t you rather be in the vicinity of Stanford Hospital if anything happened instead of in Mexico?” Hard to argue with that, so we decided to fly directly to Arizona instead. As flying became a risky option, we next thought we might drive to Arizona. Finally, we decided it was best to postpone the vacation. I’m guessing some of you went through a similar gradual awakening to the degree of risk.

Still Partying

Michelle and I truly enjoy the company of others. Staying at home precludes that, at least in the normal way…but then Zoom came to the rescue! We have had two “Zoom cocktail parties.” The first was more formal so everyone dressed up (I wore a wild Shinesty tuxedo and Michelle a matching outfit). Each couple at this virtual party had their drink of choice in front of them as well as appetizers. A few days later, Michelle and I hosted a similar party after becoming paying subscribers for Zoom. At our party we asked people to dress business casual. The benefit of requiring some higher level of dress than jeans is that it makes one feel (almost) like they are out partying.  Each party lasted a little over one hour and the conversation was pretty lively. Of course, the first 10-15 minutes were all about the impact of the virus, but then the conversation rotated through a number of less depressing subjects.

We now have been invited to a virtual dinner party by the first group host and we are planning a winery hosted party for the second group. Not sure, but in all likelihood, we’ll also work on setting up a third group. If we are still in this situation when Passover arrives, we will have our traditional seder (for 20 people) via Zoom.


Our Crossword Puzzle Tradition Continues

My family has been jointly solving the NY Times crossword puzzles for many years. More recently our grandson has not only joined in but become pretty prolific. On a typical Sunday we meet our daughter, son-in-law and their two kids for brunch and do the famous NY Times Sunday puzzle. If our son is in town, he also joins us. The only difficulty is that we each have our own copy, either on an iPhone or physical printout, so coordinating is a bit more difficult. This past weekend that tradition was replaced by doing it together over brunch at each of our homes. Once again, a Zoom conference call was the method of joining together. An added benefit was that, using Zoom, the puzzle was up on each of our large screens for all of us to share one version, and we actually finished in one of our fastest times ever!

The Wild Stock Market

As you know, at the beginning of each year I select stocks to invest in. One point I continue to make is that my picks tend to be high beta stocks so they might depreciate disproportionately in a down market. With the S&P down about 25%, this is certainly bear territory, but this is not your ordinary down market as the virus impacts different companies in different ways. I have been most fortunate in that 3 of my 6 selections, Zoom, Amazon and Docusign, should benefit from the virus. Zoom is the most obvious and this has not been lost on investors, as the stock as of this writing (March 24) is up almost 90% year to date. Of course, given the substantial day to day fluctuations this might not be the case by the time this blog is posted. Docusign should also be a major beneficiary of an increase in the number of people who work at home as its electronic document signing technology increases in importance (I’ve already had a major increase in e-signing in this past week at home). Amazon is having trouble keeping up with demand since most people have decided to rely on home delivery for fulfilling their needs. A fourth stock, Tesla is also ahead 21% year to date, but its stock has been impacted by the virus as it was up over 100% before the virus impact was felt. The other 2 stocks in my picks, Facebook and Stitch Fix, are down quite a bit but I still expect them to recover by year end despite the fact that Facebook should have lower revenue than previously forecast (advertising budgets will be cut) and Stitch Fix likely will also miss prior forecasts since people not leaving their homes are less likely to be buying a lot of new clothes – but whatever they do buy will be online (partly offsetting a reduction of total spending on new clothes).

Is it a good time to be buying stocks and/or munis?

In my last post I reminded you that the best strategy for making money in the stock market is to “Buy Low Sell High”. While this seems silly to even say, people have difficulty buying low as that is when the most fear exists (or the market wouldn’t be low). While there is danger that the impact of the virus could trigger a weak economy for at least this year, I still believe this is now mostly factored into the market and have been buying after days of large market declines. Don’t do this indiscriminately, as some companies (think physical retailers for example) may be permanently impaired, but others may also benefit from what is taking place. Still others will recover and their stocks are now trading at attractive prices. What has surprised me is there has also been an opportunity to buy munis at good rates of return (3.8% to over 4% for A or better rated bonds with 8 or more years to call/maturity). But this was only available to me on Schwab (not on several large well-known brokerage houses I use). It seems the panic for liquidity has led to better than expected returns despite 10-year Treasuries dropping to 1.02% from 2.41% a year ago. However, it also seems that several of the larger brokerage firms are not passing these returns through to their customers. Once the current “panic” situation passes (say 3 months from now) tax-free bonds with 10 years or less to call should be yielding under 2% annualized return to call leading to substantial appreciation of munis acquired at a much higher rate.

We need a Sports Interlude

Since sports are at a standstill my usual analysis of performance seems out of context. Instead I wanted to suggest something I have been thinking about for the last few months – how to punish the Houston Astros for their cheating. Given the mounting disapproval of the Baseball Commissioners lack of action perhaps he will even adopt my suggestion (of course he may never even hear of it). It’s a simple one that is the mirror image of the advantage the Astros created by stealing signs (through use of technology) in their home playoff games for about 3 years. My answer is to take away at least one home game from them in every playoff series they are in (including the World Series) for the next 3 years. If it’s a one game series, they would always play at the other team’s park. If it’s a 5-game series, they would at most have one home game, and in a 7-game series at most 2 home games. While this would not totally make up for what they did, it would at least somewhat even the playing field (no pun intended).

Back to the Virus

Given all the sacrifices many are making by sheltering in place, it should be easy to expect an immediate decline in the number of new cases. Unfortunately, the incubation period for the virus is estimated to be up to 14 days. We also have under-tested so there are more people who have it than the statistics show. With increased testing more of the actual cases will be detected. When these two factoids are combined, even if there was zero spread of the virus once the stringent asks were put in place, we would still continue to see many new cases during the 14-day period and the number would be further increased by improved testing. Unfortunately, not everyone is behaving perfectly so while I would expect (hope) that in each geography we would see substantial reduction in the number of new cases after 2 weeks of sheltering in place, the number won’t get to zero. It should take a drop but getting to zero could take much longer especially considering that part of the process to fix things still exposes medical professionals, delivery people, and more to becoming carriers of the virus.

What should Companies do to Protect their Futures?

There are a number of steps every company needs to consider in reacting to the threat posed by the virus to both health and the economy. At Azure we have been advising our portfolio companies to consider all of them. They include:

  1. First and foremost, make sure you protect your employee’s health by having them work remotely if at all possible.
  2. Draw down bank lines completely to increase liquidity in the face of potential reduced revenue and earnings.
  3. Create new forecast models based on at least 3 scenarios of reduced revenue for varying periods of time. If you were anticipating a fundraise assume it will take longer to close.
  4. If modeling indicates additional risk, consider cutting whatever costs you possibly can including:
    1. A potential reduction in workforce – while this is unpleasant you need to think about insuring survival which means the remaining employees will have jobs
    2. Reduced compensation for founders and top executives possibly in exchange for additional options
    3. Negotiating with your landlord (for reduced or delayed rent) as well as other vendors
    4. Eliminating any unnecessary discretionary spending
    5. Evaluating the near-term ROAS (return on advertising spend). On the one hand, preserving capital may mean the need to cut if the payback period is more than a few months. On the other hand, since advertising cost is likely to be lower given reduced demand (for example the travel industry likely will completely shut down advertising as will physical retail) it is possible you may find that increasing marketing adds to cash flow!
  5. Think about how you might play offense – are there things you can offer new and/or existing customers to induce them to spend more time on your site or app (and perhaps increase buying) in this environment?

Stay Safe

While I was a sceptic regarding how pandemic this pandemic would be, I eventually realized that there was little downside in being more cautious. So please follow the guidelines in your area. It is easy to order just about anything online so going out to shop is an unnecessary risk. As they said in the Hunger Games: “May the odds be ever in your favor!” But, unlike the Hunger Games you can improve the odds.

The Impact of Gen Z on Marketing

Azure Marketing Day

Each year, Azure hosts a marketing day for CMOs and CEOs of its consumer-facing portfolio companies. This year, on February 27th, we had sessions on the following topics:

  • Refreshing Your Brand as the Business Grows
  • Metrics for Evaluating Successful Marketing
  • Leveraging Comedy to Lower Customer Acquisition Cost
  • Know the Next Generation: An introduction to Gen Z
  • The Benefits and Drawbacks of a Multi-Channel Strategy
  • Influencer Strategies
  • Optimizing Pinterest

I presented the one on Metrics, but the other sessions are conducted by a combination of portfolio executives and outside speakers, each a leading thinker on the topic. Since I invariably learn quite a lot from other speakers, it seems only fair to borrow from their talks for a few blog posts so that I can share these benefits.

Much of this post will be based on concepts that I found especially enlightening from the session by Chris Bruzzo, the current CMO of Electronic Arts, on knowing Generation Z. I won’t cite each place I am using something from Chris versus my own thoughts; but you can assume much of the content emanates from Chris. Since Chris is one of the most creative thinkers in marketing, I’m hoping this will make me look good!

Marketers have Defined Generational Characteristics

Marketers often use personas to help understand what they need to do to address different types of customers. A persona may be:

  • A married woman 35 years old with a job and 2 children aged 6 and 9;
  • A 16-year-old male who is a sophomore in high school;
  • A non-working woman aged 50

A great deal of research has been done on the characteristics of particular “personas” to better enable a company to create and market products that meet their needs. One categorization of people is by age, with 5 different generations being profiled. The youngest group to emerge as important is Gen Z, roughly defined as those born between 1995 and 2012. Currently the U.S. population over 12 years old is distributed as follows:

What this means is that Gen Z has become a significant portion of the population to consider when creating and marketing products. With that in mind, let’s compare several characteristics of the youngest three of these groups.

Source: EA Research

Gen Z is the first generation that are digital natives. They are profiled as having cautious optimism, wanting to be connected, seeking community and wanting to create and control things. Earlier generations, including Millennials, watched TV an increasing number of hours, often multi-tasking while they did. Gen Z has replaced much of TV watching with device “screen time”, including visiting YouTube (72% of Gen Z visit it daily). When asked “What device would you pick if you could have only one?”, GenZers chose the TV less than 5% of the time. Prior generations respond well to email marketing while Gen Z needs to be reached through social media. Gen Z has little tolerance for barriers of entry for reaching a site and will just move on (I feel the same way and think many members of other generations do as well).  So, when targeting new customers (especially Gen Z) remove barriers to entry like requiring registration before a user becomes a customer. It is important to demonstrate value to them first.

Gen Z grew up in an era where the Internet was part of life and smart phones were viewed as essential… rather than a luxury. On average they spend 40% of their free time on screens. What is even more eye opening is that 91% go to bed with their devices. Advertisers have responded to these trends by gradually shifting more of their spend online. This has been difficult for newspapers and magazines for quite a while, but now it is also having a major impact on flattening out the use of TV as an advertising medium.

There are several implications from the numbers shown in the above chart. First, it is very clear to see that newspapers and magazines as we know them are not viable. This has led to iconic players like the New York Times and Fortune monetizing their brands through conferences, trips, wine clubs, and more. Lesser known brands have simply disappeared. In 2018, TV revenue continued to grow slightly despite losing share as the smaller share was of a larger pie. But in 2019, TV advertising dollars declined, and the decline is forecast to continue going forward. Several factors can be attributed to this but certainly one is that brands targeting Gen Z are aware that TV is not their medium of choice. One unintended consequence of major brands shifting spend to the Internet is that because they are less price sensitive to cost than eCommerce companies, this has led to higher pricing by Facebook and Google.

Personalization is Becoming “Table Stakes” and Offering Co-Creation is a Major Plus

Consumers, in general, and especially Gen Z, are demanding that brands do more to personalize products to their needs and interests. In fact, Gen Z even wants to participate in product creation. One example involves Azure portfolio company Le Tote. The company, much like Stitch Fix, uses algorithms to personalize the clothing it sends based on specifics about each customer. When the company added the ability for consumers to personalize their box (from the already personalized box suggested by the algorithm) there was a sizeable spike in satisfaction…despite the fact that the items the consumer substituted led to a decline in how well the clothes fit! This example shows that using customer data to select new items is only a first step in personalization. Letting the customer have more of a say (be a co-creator) is even more important. 

Conclusions

  1. Startups need to diversify their marketing spend away from Facebook and Google as the ROI on these channels has contracted. At the Azure marketing day, we highlighted testing whether Pinterest, influencers, brick and mortar distribution and/or comedy might be sources that drive a higher ROI.
  2. If Gen Zers are being targeted, YouTube, Snap, Instagram, and Twitch are likely better places to market
  3. When targeting new customers (especially Gen Z) remove barriers to entry like requiring registration before a user becomes a customer. It is important to demonstrate value to them first.
  4. Build great apps for iPhones and Android phones but what is becoming most important is making sure that smart phones work well on your site without requiring an app, as most Gen Zers will use their phones for access. When they do, the mobile web version needs to be strong so that they don’t need to download your app before discovering the value you offer.
  5. Involve customers as much as possible in the design/selection/creation of your products as this extends personalization to “co-creation” and will increase satisfaction.

Soundbytes

  • Readers are aware that I invest in growth stocks (some of which I suggest to you) to achieve superior performance. What you may not be aware of is that over the past 25 years my strategy for investing has been to put the majority of capital in A or better rated municipal bonds (Munis) to generate income in a relatively safe way (and I believe everyone should diversify how they apportion capital). I use a complex strategy to generate superior returns and in the past 25 years I have earned, on average, between 4% and 5% tax free annually.  But in the current environment new investments in Munis will have much lower yields so I have started to look at “safe” alternatives to generate income. This type of investment is for income generation and involves a different category of stocks than the growth stocks I target for high returns through stock appreciation.
  • Given the recent downturn in the stock market I did my first “bond alternative” investment earlier this week. My goal is to generate income of over 5% on an after-tax basis in stocks that are “safe” investments from the point of view of continuing to deliver dividends at or above current levels.
  • My first set of transactions was in Bristol Myers Squibb:
    • I bought the stock at $56.48 where the dividend is 3.2% per year
    • I sold Jan 21 calls at a strike price of 60 and received $4.95
    • If the stock is not called my cash yield, including $1.80 in dividends, would be $6.75 over less than one year which would equal 12% before taxes
    • I also sold Jan 21 puts at a strike price of $55 and received $6.46. If the stock is not put to me and is not called that would increase my one-year yield to over 23% of the $56.48 stock price and I would repeat the sale of calls and puts next year. Since my net cost was $43.27 the percentage yield would be over 30% of my cash outlay.
    • If the stock was called my net gain would equal the profit on the stock, the dividends for one year plus the premiums on the options and would exceed 30%
    • If the stock went below $55 and was put to me at that price I would be ok with that as the new shares would have a net cost of just over $49 with a dividend yield of close to 4.0% (assuming the company follows past practice of raising dividends each year) and I could sell new puts at a lower strike price.  
  • The second stock I invested in for income is AT&T.
    • I bought the stock at $34.60 where the dividend is 6.0% per year
    • I sold Jan 21 calls at a strike price of $37 and received $2.05 per share
    • If the stock is not called my year 1 cash yield would be $4.13 per share over less than a year or about 12% before taxes
    • I also sold Jan 21 puts with a strike of $32 and received $3.30 per share. If the stock is not put to me and is not called, that would increase my one-year yield to over 20% of the stock price and over 25% of the net cash outlay
    • If the stock was called, I would only have 3 quarters of dividends, but the gain would be over 30% of my net original cash outlay
    • If the stock was put to me my cost of the new shares, after subtracting the put premium would be $28.70 and the dividend alone would provide a 7.2% pre-tax yield and I could sell new puts at a lower price.
  • We shall see how this works out but unless they cut the dividends, I won’t worry if the stock is lower a year from now as that would only increase my yield on new stock purchased due to the puts. The chance of either company cutting dividends seems quite low which is why I view this as a “safe” alternative to generate income as I won’t sell either stock unless they are called at the higher strike price.
  • I also began reserving capital starting about a month ago as I expected the virus to impact the market. These purchases used about 10% of what I had put aside. I put another 15% to work on Friday, March 13 as the market had fallen further and valuations have become quite attractive – remember the secret is to “buy low, sell high”. When the market is low its always scary or it wouldn’t be low! I do confess that I didn’t sell much when it was high as I tend to be a long-term holder of stocks I view as game changers…so I missed the opportunity to sell high and then repurchase low.

Discussion of Sophisticated Valuation Methodology

In the long run, companies should be valued based on future earnings flows. Since this is often nearly impossible to calculate, proxies are often used instead. I find it difficult to competently determine what proxies should be used for cyclical companies, so will ignore them as they are not in my universe in venture or public investing. The focus of this post will be on exploring valuation for high-growth companies.

Companies that are already at or near their long-term model for profitability are often valued based on a multiple of earnings. If they are still in their high growth phase, they are likely to have increasing earnings over time and should therefore command a higher multiple than those that are growing slowly or not at all. Much analysis has been done to compare various such entities based on how their multiple of earnings varies depending on their level of growth. There will be a strong correlation between their multiple of earnings and level of growth, but other factors such as the “dependability of growth and earnings” can lead to wide variations in valuations.  For example, a company that has a SaaS business model with greater than 100% revenue retention would usually be viewed as one where growth is “safer” … thus commanding a higher multiple than those with different models.

What about companies that are not near their long-term profit model?   

Many of the companies that have recently gone public are a long way from reaching their long-term business model, and so other methods of valuing them must be used. Often, Investment Bankers suggest a multiple of revenue as one method. By considering how “comparable” companies trade based on revenue and growth a suggested valuation can be derived:

Table 1 Valuation of Comparable Companies

Table 1 shows a sample of what an investment banker might use as one method of determining potential valuation. However, there are many weaknesses to this approach. The biggest of which is: “what makes a company a comparable?” Usually companies selected are in the same sector. But, within a sector, business models can vary widely. For example, a sector like eCommerce has companies that:

  1. Sell physical goods which are not their own brands
  2. Sell physical goods that are their own brands
  3. Are a marketplace in which sellers list their goods and the company facilitates sales, collects the money and pays the seller (e.g., eBay).  Such a company’s revenue is not the sales of the goods but instead the marketplace commission.
  4. Sell virtual goods that are their own

There can be wide variation in gross margin among the four categories, but in general, gross margins are higher as we go from 1 to 2 to 3 to 4. In fact, companies in category 1 often have gross margins in the 20% to 40% range, those in category 2 in the 40% to 70% range, those in category 3 in the 70% to 90% range and those in category 4 in the 85% to 95% range. What this means is that all other things being equal the potential earnings at scale for these will depend more on its business model than on the sector.  

To test our theory of whether using a multiple of Gross Margin was a better measure of value than a multiple of revenue, we plotted the relationship between growth and valuation using each of these methods.  It turns out there is a correlation between valuation as a multiple of revenue based on revenue growth regardless of industry. We found the correlation coefficient for it to be 0.36, an indication of a moderate relationship. This was still far better than the correlation between slow growth and high growth plays that just happen to be in the same industry. So, I believe (based on evidence) that growth is a better indicator of multiple than industry sector.

In that same post we plotted the relationship between revenue growth and valuation as a multiple of gross margin dollars (GMD). For the remainder of this post I’ll use multiple to mean the multiple of GMD. Since it seemed obvious that GM% is a better indicator of future earnings than revenue, I wasn’t surprised that the correlation coefficient was a much higher 0.62, an indication of a much stronger relationship. While other factors like dependability of revenue, market size, perceived competitive advantage and more will affect the multiple, I decided that this method of assessing valuation was strong enough that I use the resulting least square regression formula as a way of getting a starting approximation for the value of a company that has yet to reach “business model maturity”.

Why Contribution Margin is a better indicator than Gross Margin of future earnings.

The reason the correlation coefficient between GMD multiples and revenue growth is 0.62 rather than a number much closer to 1.0 is that a number of other factors play a role in determining future earnings. For me, the most important one is Contribution Margin, which considers the marketing/sales cost spent each month to help drive revenue (think of it as GMD minus marketing/sales cost). Contribution Margin indicates how quickly the benefits of scaling the business will enable reaching mature earnings. When I look at a company that has low contribution margins it is difficult to see how it can generate substantial profits unless it can improve gross margin and/or reduce marketing spend as a percentage of sales. That is why the bull story on Spotify is that it will get the music labels to substantially reduce their royalty level (from close to 80%), or for Uber is that it will go to self-driving vehicles or why Blue Apron keeps reducing its marketing spend in an effort to increase contribution margin. The argument then becomes a speculation on why the multiple should be of a “theoretically” higher amount.  I would like to plot revenue growth versus the multiple of Contribution Margin to obtain a new least square formula, which I am confident would have a higher correlation coefficient.  Unfortunately, many companies do not readily identify variable marketing/sales cost so instead I analyze where it is likely to be, and factor that into how I view valuation.

Other Factors to Consider for Understanding a Company’s Valuation

  1. Recurring revenue models should have a higher multiple: Business to Business SaaS (Software as a Service) companies usually trade at higher multiples than those with other models that are growing at the same rate. The reason is simple: their customers are likely to stay on their platforms for a decade or more and often increase what they spend over time. This creates a situation where a portion of revenue growth can be sustained even before adding the marketing spend to acquire future customers which in turn should lead to higher Contribution Margins.
  2. Companies that are in markets that are likely to grow at a high rate for 5 years or more should have higher multiples: If the market a company plays in is growing quickly there is more opportunity to sustain high growth levels for a longer time, leading to a likelihood of greater future earnings.
  3. Companies with substantial competitive advantage should have higher multiples: Any company that has a product that it is difficult to replicate can elevate its margins and earnings for a long period of time. One of the best examples of this is pharmaceutical companies, where their drug patents last for 20 years. Even after the patent expires the original holder will continue to sell the drug at a much higher price than its generic alternatives and still maintain strong market share.
  4. Companies that are farther away from generating actual earnings should trade at lower multiples than those that are close or already generating some earnings: The reason for this is obvious to me but it is often not the case … especially for newly minted IPOs. I believe there is considerable risk that such companies will take many years to reach profitability (if they do at all) and that when they do it will only be a modest portion of revenue. I started this post by saying that eventually valuations should reflect the present value of future earnings flows. The longer it takes to get to mature earnings, the lower its present value (see table 2). If tangible earnings started 7 years out (vs immediately) the discounted value of the flow would be reduced by more than half – reflecting that the valuation of the company should be half that of a company with a similar earnings flow that started immediately.

Table 2: Present value of future dollars using a 12% discount rate

How I bet on my Valuation Methodology.

Consider the three recommendations in my last post that have had their IPO between November of 2017 and mid-2019: DocuSign, Stitch fix and Zoom. They all are profitable already. Two are B to B SaaS companies with greater than 100% revenue retention (that means that the cohort of customers they had a year ago, including those that churned, are spending more today than when they started). The third has existing customers increasing their year over spend as well. They are all growing at a strong pace.

SoundBytes

  • While I did not include it in my recommended stocks for 2020, I recently purchased shares in Pinterest (at $19.50 per share), one of the three 2019 Unicorn IPOs (of the nine I highlighted in my last post) that was already profitable. Based on my valuation methods it is at a reasonable valuation, grew 47% year over year in its last reported quarter, and appears well positioned to grow at a high level for many years. What I find surprising is the comparison to the valuation of Snap. Snap is growing at roughly the same pace (50% in the last reported quarter), had an adjusted EBITDA loss of nearly 10% in Q3 and yet was trading at nearly double the multiple of GMD. 
  • I can’t help mentioning that we predicted that Tesla was likely to have a great Q4 in our post in November, based on the long wait time for my getting a model 3 I had ordered, coupled with manufacturing cranking out more expensive model S and X versions for most of the quarter, and that the Chinese factory was starting to produce cars. At the time the stock was $333 per share. Now, after it has risen over 200 points a number of analysts are saying the same thing.

2020 Top Ten Predictions

I wanted to start this post by repeating something I discussed in my top ten lists in 2017 and 2018 which I learned while at Sanford Bernstein in my Wall Street days: “Owning companies that have strong competitive advantages and a great business model in a potentially mega-sized market can create the largest performance gains over time (assuming one is correct).” It does make my stock predictions somewhat boring (as they were on Wall Street where my top picks, Dell and Microsoft each appreciated over 100X over the ten years I was recommending them).

Let’s do a little simple math. Suppose one can generate an IRR of 26% per year (my target is to be over 25%) over a long period of time.  The wonder of compounding is that at 26% per year your assets will double every 3 years. In 6 years, this would mean 4X your original investment dollars and in 12 years the result would be 16X. For comparison purposes, at 5% per year your assets would only be 1.8X in 12 years and at 10% IRR 3.1X.  While 25%+ IRR represents very high performance, I have been fortunate enough to consistently exceed it (but always am worried that it can’t keep up)! For my recommendations of the past 6 years, the IRR is 34.8% and since this exceeds 26%, the 6-year performance  is roughly 6X rather than 4X.

What is the trick to achieving 25% plus IRR? Here are a few of my basic rules:

  1. Start with companies growing revenue 20% or more, where those closer to 20% also have opportunity to expand income faster than revenue
  2. Make sure the market they are attacking is large enough to support continued high growth for at least 5 years forward
  3. Stay away from companies that don’t have profitability in sight as companies eventually should trade at a multiple of earnings.
  4. Only choose companies with competitive advantages in their space
  5. Re-evaluate your choices periodically but don’t be consumed by short term movement

As I go through each of my 6 stock picks I have also considered where the stock currently trades relative to its growth and other performance metrics. With that in mind, as is my tendency (and was stated in my last post), I am continuing to recommend Tesla, Facebook, Amazon, Stitch Fix and DocuSign. I am adding Zoom Video Communications (ZM) to the list. For Zoom and Amazon I will recommend a more complex transaction to achieve my target return.

2020 Stock Recommendations:

1. Tesla stock appreciation will continue to outperform the market (it closed last year at $418/share)

Tesla is likely to continue to be a volatile stock, but it has so many positives in front of it that I believe it wise to continue to own it. The upward trend in units and revenue should be strong in 2020 because:

  • The model 3 continues to be one of the most attractive cars on the market. Electric Car Reviews has come out with a report stating that Model 3 cost of ownership not only blows away the Audi AS but is also lower than a Toyota Camry! The analysis is that the 5-year cost of ownership of the Tesla is $0.46 per mile while the Audi AS comes in 70% higher at $0.80 per mile. While Audi being more expensive is no surprise, what is shocking is how much more expensive it is. The report also determined that Toyota Camry has a higher cost as well ($0.49/mile)! Given the fact that the Tesla is a luxury vehicle and the Camry is far from that, why would anyone with this knowledge decide to buy a low-end car like a Camry over a Model 3 when the Camry costs more to own?  What gets the Tesla to a lower cost than the Camry is much lower fuel cost, virtually no maintenance cost and high resale value. While the Camry purchase price is lower, these factors more than make up for the initial price difference
  • China, the largest market for electronic vehicles, is about to take off in sales. With the new production facility in China going live, Tesla will be able to significantly increase production in 2020 and will benefit from the car no longer being subject to import duties in China.  
  • European demand for Teslas is increasing dramatically. With its Chinese plant going live, Tesla will be able to partly meet European demand which could be as high as the U.S. in the future. The company is building another factory in Europe in anticipation. The earliest indicator of just how much market share Tesla can reach has occurred in Norway where electric cars receive numerous incentives. Tesla is now the best selling car in that country and demand for electric cars there now exceeds gas driven vehicles.

While 2020 is shaping up as a stairstep uptick in sales for Tesla given increased capacity and demand, various factors augur continued growth well beyond 2020. For example, Tesla is only partway towards having a full lineup of vehicles. In the future it will add:

  • Pickup trucks – where pre-orders and recent surveys indicate it will acquire 10-20% of that market
  • A lower priced SUV – at Model 3 type pricing this will be attacking a much larger market than the Model X
  • A sports car – early specifications indicate that it could rival Ferrari in performance but at pricing more like a Porsche
  • A refreshed version of the Model S
  • A semi – where the lower cost of fuel and maintenance could mean strong market share.

2. Facebook stock appreciation will continue to outperform the market (it closed last year at $205/share)

Facebook, like Tesla, continues to have a great deal of controversy surrounding it and therefore may sometimes have price drops that its financial metrics do not warrant. This was the case in 2018 when the stock dropped 28% in value during that year. While 2019 partly recovered from what I believe was an excessive reaction, it’s important to note that the 2019 year-end price of $205/share was only 16% higher than at the end of 2017 while trailing revenue will have grown by about 75% in the 2-year period. The EPS run rate should be up in a similar way after a few quarters of lower earnings in early 2019. My point is that the stock remains at a low price given its metrics. I expect Q4 to be quite strong and believe 2020 will continue to show solid growth.

The Facebook platform is still increasing the number of active users, albeit by only about 5%-6%. Additionally, Facebook continues to increase inventory utilization and pricing. In fact, given what I anticipate will be added advertising spend due to the heated elections for president, senate seats, governorships etc., Facebook advertising inventory usage and rates could increase faster (see prediction 7 on election spending).  

Facebook should also benefit by an acceleration of commerce and increased monetization of advertising on Instagram. Facebook started monetizing that platform in 2017 and Instagram revenue has been growing exponentially and is likely to close out 2019 at well over $10 billion. A wild card for growth is potential monetization of WhatsApp. That platform now has over 1.5 billion active users with over 300 million active every day. It appears close to beginning monetization.

The factors discussed could enable Facebook to continue to grow revenue at 20% – 30% annually for another 3-5 years making it a sound longer term investment.

3. DocuSign stock appreciation will continue to outperform the market (it closed last year at $74/share)

DocuSign is the runaway leader in e-signatures facilitating multiple parties signing documents in a secure, reliable way for board resolutions, mortgages, investment documents, etc. Being the early leader creates a network effect, as hundreds of millions of people are in the DocuSign e-signature database. The company has worked hard to expand its scope of usage for both enterprise and smaller companies by adding software for full life-cycle management of agreements. This includes the process of generating, redlining, and negotiating agreements in a multi-user environment, all under secure conditions. On the small business side, the DocuSign product is called DocuSign Negotiate and is integrated with Salesforce.

The company is a SaaS company with a stable revenue base of over 560,000 customers at the end of October, up well over 20% from a year earlier. Its strategy is one of land and expand with revenue from existing customers increasing each year leading to a roughly 40% year over year revenue increase in the most recent quarter (fiscal Q3). SaaS products account for over 95% of revenue with professional services providing the rest. As a SaaS company, gross margins are high at 79% (on a non-GAAP basis).

The company has now reached positive earnings on a non-GAAP basis of $0.11/share versus $0.00 a year ago. I use non-GAAP as GAAP financials distort actual results by creating extra cost on the P&L if the company’s stock appreciates. These costs are theoretic rather than real.

My only concern with this recommendation is that the stock has had a 72% runup in 2019 but given its growth, move to positive earnings and the fact that SaaS companies trade at higher multiples of revenue than others I still believe it can outperform this year.

4. Stitch Fix Stock appreciation will continue to outperform the market (it closed last year at $25.66/share)

Stitch Fix offers customers, who are primarily women, the ability to shop from home by sending them a box with several items selected based on sophisticated analysis of her profile and prior purchases. The customer pays a $20 “styling fee” for the box which can be applied towards purchasing anything in the box. The company is the strong leader in the space with revenue approaching a $2 billion run rate. Unlike many of the recent IPO companies, it has shown an ability to balance growth and earnings. The stock had a strong 2019 ending the year at $25.66 per share up 51% over the 2018 closing price. Despite this, our valuation methodology continues to show it to be substantially under valued and it remains one of my picks for 2020. The likely cause of what I believe is a low valuation is a fear of Amazon making it difficult for Stitch Fix to succeed. As the company gets larger this fear should recede helping the multiple to expand.  

Stitch Fix continues to add higher-end brands and to increase its reach into men, plus sizes and kids. Its algorithms to personalize each box of clothes it ships keeps improving. Therefore, the company can spend less on acquiring new customers as it has increased its ability to get existing customers to spend more and come back more often. Stitch Fix can continue to grow its revenue from women in the U.S. with expansion opportunities in international markets over time. I believe the company can continue to grow by roughly 20% or more in 2020 and beyond.

Stitch Fix revenue growth (of over 21% in the latest reported quarter) comes from a combination of increasing the number of active clients by 17% to 3.4 million, coupled with driving higher revenue per active client. The company accomplished this while generating profits on a non-GAAP basis.

5. Amazon stock strategy will outpace the market (it closed last year at $1848/share).

Amazon shares increased by 23% last year while revenue in Q3 was up 24% year over year. This meant the stock performance mirrored revenue growth. Growth in the core commerce business has slowed but Amazon’s cloud and echo/Alexa businesses are strong enough to help the company maintain roughly 20% growth in 2020. The company continues to invest heavily in R&D with a push to create automated retail stores one of its latest initiatives. If that proves successful, Amazon can greatly expand its physical presence and potentially increase growth through the rollout of numerous brick and mortar locations. But at its current size, it will be difficult for the company to maintain over 20% revenue growth for many years (excluding acquisitions) so I am suggesting a more complex investment in this stock:

  1. Buy X shares of the stock (or keep the ones you have)
  2. Sell Amazon puts for the same number of shares with the puts expiring on January 15, 2021 and having a strike price of $1750. The most recent sale of these puts was for over $126
  3. So, net out of pocket cost would be reduced to $1722
  4. A 20% increase in the stock price (roughly Amazon’s growth rate) would mean 29% growth in value since the puts would expire worthless
  5. If the stock declined 226 points the option sale would be a break-even. Any decline beyond that and you would lose additional dollars.
  6. If the options still have a premium on December 31, I will measure their value on January 15, 2021 for the purposes of performance.

6. I’m adding Zoom Video Communications to the list but with an even more complex investment strategy (the stock is currently at $72.20)

I discussed Zoom Video Communications (ZM) in my post on June 24, 2019. In that post I described the reasons I liked Zoom for the long term:

  1. Revenue retention of a cohort was about 140%
  2. It acquires customers very efficiently with a payback period of 7 months as the host of a Zoom call invites various people to participate in the call and those who are not already Zoom users can be readily targeted by the company at little cost
  3. Gross Margins are over 80% and could increase
  4. The product has been rated best in class numerous times
  5. Its compression technology (the key ingredient in making video high quality) appears to have a multi-year lead over the competition
  6. Adding to those reasons it’s important to note that ZM is improving earnings and was slightly profitable in its most recent reported quarter

The fly in the ointment was that my valuation technology showed that it was overvalued. However, I came up with a way of “future pricing” the stock. Since I expected revenue to grow by about 150% over the next 7 quarters (at the time it was growing over 100% year over year) “future pricing” would make it an attractive stock. This was possible due to the extremely high premiums for options in the stock. So far that call is working out. Despite the company growing revenue in the 3 quarters subsequent to my post by over 57%, my concern about valuation has proven correct and the stock has declined from $76.92 to $72.20. If I closed out the position today by selling the stock and buying back the options (see Table 1) my return for less than 7.5 months would be a 42% profit. This has occurred despite the stock declining slightly due to shrinkage in the premiums.

Table 1: Previous Zoom trade and proposed trade

I typically prefer using longer term options for doing this type of trade as revenue growth of this magnitude should eventually cause the stock to rise, plus the premiums on options that are further out are much higher, reducing the risk profile, but I will construct this trade so that the options expire on January 15, 2021 to be able to evaluate it in one year. In measuring my performance we’ll use the closing stock price on the option expiration date, January 15, 2021 since premiums in options persist until their expiration date so the extra 2 weeks leads to better optimization of the trade.

So, here is the proposed trade (see table 1):

  1. Buy X shares of the stock at $72.20 (today’s price)
  2. Sell Calls for X shares expiring January 15, 2021 at a strike of $80/share for $11.50 (same as last price it traded)
  3. Sell puts for X shares expiring January 15, 2021 with strike of $65/share for $10.00 (same as last price it traded)

I expect revenue growth of 60% or more 4 quarters out. I also expect the stock to rise some portion of that, as it is now closer to its value than when I did the earlier transaction on May 31, 2019. Check my prior post for further analysis on Zoom, but here are 3 cases that matter at December 31, 2020:

  • Stock closes over $80/share (up 11% or more) at end of the year: the profit would be 58% of the net cost of the transaction
    • This would happen because the stock would be called, and you would get $80/share
    • The put would expire worthless
    • Since you paid a net cost of $50.70, net profit would be $29.30
  • Stock closes flat at $72.20:  your profit would be $21.50 (42%)
    • The put and the call would each expire worthless, so you would earn the original premiums you received when you sold them
    • The stock would be worth the same as what you paid
  • Stock closes at $57.85 on December 31: you would be at break even. If it closed lower, then losses would accumulate twice as quickly:
    • The put holder would require you to buy the stock at the put exercise price of $65, $7.15 more than it would be worth
    • The call would expire worthless
    • The original stock would have declined from $72.20 to $57.85, a loss of $14.35
    • The loss on the stock and put together would equal $21.50, the original premiums you received for those options

Outside of my stock picks, I always like to make a few non-stock predictions for the year ahead.

7. The major election year will cause a substantial increase in advertising dollars spent

According to Advertising Analytics political spending has grown an average of 27% per year since 2012. Both the rise of Super PACs and the launch of online donation tools such as ActBlue have substantially contributed to this growth. While much of the spend is targeted at TV, online platforms have seen an increasing share of the dollars, especially Facebook and Google. The spend is primarily in even years, as those are the ones with senate, house and gubernatorial races (except for minor exceptions). Of course, every 4th year this is boosted by the added spend from presidential candidates. The Wall Street Journal projects the 2020 amount will be about $9.9 billion…up nearly 60% from the 2016 election year. It should be noted that the forecast was prior to Bloomberg entering the race and if he remains a viable candidate an additional $2 billion or more could be added to this total.

The portion targeted at the digital world is projected to be about $2.8 billion or about 2.2% of total digital ad spending. Much of these dollars will likely go to Facebook and Google. This spend has a dual impact: first it adds to the revenue of each platform in a direct way, but secondly it can also cause the cost of advertising on those platforms to rise for others as well.

8. Automation of Retail will continue to gain momentum

This will happen in multiple ways, including:

  1. More Brick & Mortar locations will offer some or all the SKUs in the store for online purchase through Kiosks (assisted by clerks/sales personnel). By doing this, merchants will be able to offer a larger variety of items, styles, sizes and colors than can be carried in any one outlet. In addition, the consolidation of inventory achieved in this manner will add efficiency to the business model. In the case of clothing, such stores will carry samples of items so the customer can try them on, partly to optimize fit but also to determine whether he or she likes the way it looks and feels on them. If one observes the massive use of Kiosks at airports it becomes obvious that they reduce the number of employees needed and can speed up checking in. One conclusion is this will be the wave of the future for multiple consumer-based industries.
  2. Many more locations will begin incorporating technology to eliminate the number of employees needed in their stores. Amazon will likely be a leader in this, but others will also provide ways to reduce the cost of ordering, picking goods, checking out and receiving information while at the store.

9. The Warriors will come back strong in the 2020/21 season

Let me begin by saying that this prediction is not being made because I have been so humbled by my miss in the July post where I predicted that the Warriors could edge into the 2020 playoffs and then contend for a title if Klay returned in late February/early March. Rather, it is based on analysis of their opportunity for next season and also an attempt to add a little fun to my Top Ten List!  The benefit of this season:

  • Klay and Curry are getting substantial time off after 5 seasons of heavy stress. They should be refreshed at the start of next season
  • Russell, assuming he doesn’t keep missing games with injuries, is learning the Warriors style of play
  • Because of the injuries to Klay, Curry, Looney, and to a lesser extent Green and Russell, several of the younger members of the team are getting experience at a much more rapid rate than would normally be possible and the Warriors are able to have more time to evaluate them as potential long-term assets
  • If the Warriors continue to lose at their current rate, they will be able to get a high draft choice for the first time since 2012 when they drafted Harrison Barnes with the 7th pick. Since then their highest pick has been between the 28th and 30th player chosen (30 is the lowest pick in the first round)
  • The Warriors will have more cap space available to sign a quality veteran
  • Andre Iguodala might re-sign with the team, and while this is not necessary for my prediction it would be great for him and for the team
  • The veterans should be hungry again after several years of almost being bored during the regular season

I am assuming the Warriors will be relatively healthy next season for this to occur.

10. At least one of the major Unicorns will be acquired by a larger player

In 2019, there was a change to the investing environment where most companies that did not show a hint of potential profitability had difficulty maintaining their market price. This was particularly true of highly touted Unicorns, which mostly struggled to increase their share price dramatically from the price each closed on the day of their IPO. Table 2 shows the 9 Unicorns whose IPOs we highlighted in our last post. Other than Beyond Meat, Zoom and Pinterest, they all appear some distance from turning a proforma profit. Five of the other six are below their price on the first day’s close. A 6th, Peloton, is slightly above the IPO price (and further above the first days close). Beyond Meat grew revenue 250% in its latest quarter and moved to profitability as well. Its stock jumped on the first day and is even higher today.  While Pinterest is showing an ability to be profitable it is still between the price of the IPO and its close on the first day of trading.  Zoom, which is one of our recommended buys, was profitable (on a Non-GAAP basis) and grew revenue 85% in its most recent quarter. A 10th player, WeWork, had such substantial losses that it was unable to have a successful IPO.

Table 2: Recent Unicorn IPOs Stock Price & Profitability Comparisons

Something that each of these companies have in common is that they are all growing revenue at 30% or more, are attacking large markets, and are either in the leadership position in that market or are one of two in such a position. Because of this I believe one or more of these (and comparable Unicorns) could be an interesting acquisition for a much larger company who is willing to help make them profitable. For such an acquirer their growth and leadership position could be quite attractive.

Recap of 2019 Top Ten Predictions

Bull Markets have Tended to Favor My Stock Picks

I entered 2019 with some trepidation as my favored stocks are high beta and if the bear market of the latter portion of 2018 continued, I wasn’t sure I would once again beat the market…it was a pretty close call last year. However, I felt the companies I liked would continue to grow their revenue and hoped the market would reward their performance. As it turns out, the 5 stocks I included in my top ten list each showed solid company performance and the market returned to the bull side. The average gain for the stocks was 45.7% (versus the S&P gain of 24.3%).

Before reviewing each of my top ten from last year, I would like to once again reveal long term performance of the stock pick portion of my top ten list. For my picks, I assume equal weighting for each stock in each year to come up with my performance and then compound the yearly gains (or losses) to provide my 6-year performance. For the S&P my source is Multpl.com.  I’m comparing the S&P index at January 2 of each year to determine annual performance.  My compound gain for the 6-year period is 499% which equates to an IRR of 34.8%. The S&P was up 78% during the same 6-year period, an IRR of 10.1%.

The 2019 Top Ten Predictions Recap

One of my New Year’s pledges was to be more humble, so I would like to point out that I wasn’t 10 for 10 on my picks. One of my 5 stocks slightly under-performed the market and one of my non-stock forecasts was a mixed bag. The miss on the non-stock side was the only forecast outside of tech, once again highlighting that I am much better off sticking to the sector I know best (good advice for readers as well). However, I believe I had a pretty solid year in my forecasts as my stock portfolio (5 of the picks) significantly outperformed the market, with two at approximately market performance and three having amazing performance with increases of 51% to 72%. Regarding the 5 non-stock predictions, 4 were right on target and the 5th was very mixed. As a quick reminder, my predictions were:

Stock Portfolio 2019 Picks:

  • Tesla stock will outpace the market (it closed last year at $333/share and opened this year at $310)
  • Facebook Stock will outpace the market (it closed last year at $131/share)
  • Amazon Stock will outpace the market (it opened the year at $1502/share)
  • Stitch Fix stock appreciation will outpace the market (it closed last year at $17/share)
  • DocuSign stock will outpace the market in 2019 (it is currently at $43/share and opened the year at $41)

5 Non-Stock Predictions:

  • Replacing cashiers with technology will be proven out in 2019
  • Replacing cooks, baristas, and waitstaff with robots will begin to be proven in 2019
  • Influencers will be increasingly utilized to directly drive commerce
  • The Cannabis Sector should show substantial gains in 2019
  • 2019 will be the year of the unicorn IPO

In the discussion below, I’ve listed in bold each of my ten predictions and give an evaluation of how I fared on each.

Tesla stock will outpace the market (it closed last year at $333/share and opened this year at $310)

Tesla proved to be a rocky ride through 2019 as detractors of the company created quite a bit of fear towards the middle of the year, driving the stock to a low of $177 in June. A sequence of good news followed, and the stock recovered and reached a high of $379 in front of the truck unveiling. I’m a very simplistic guy when I evaluate success as I use actual success as the measure as opposed to whether I would buy a product. Critics of the truck used Elon’s unsuccessful demonstration of the truck being “bulletproof” and the fact that it was missing mirrors and windshield wipers to criticize it. Since it is not expected to be production ready for about two years this is ridiculous! If the same critics applied a similar level of skepticism to the state of other planned competitive electric vehicles (some of which are two plus years away) one could conclude that none of them will be ready on time. I certainly think the various announced electric vehicles from others will all eventually ship, but do not expect them to match the Tesla battery and software capability given its 3 to 5-year lead. I said I’m a simple guy, so when I evaluate the truck, I look at the 250,000 pre-orders and notice it equates to over $12.5B in incremental revenue for the product! While many of these pre-orders will not convert, others likely will step in. To me that is strong indication that the truck will be an important contributor to Tesla growth once it goes into production.

Tesla stock recovered from the bad press surrounding the truck as orders for it mounted, the Chinese factory launch was on target and back order volume in the U.S. kept factories at maximum production.  Given a late year run the stock was up to $418 by year end, up 34.9% from the January opening price. But for continuing recommendations I use the prior year’s close as the benchmark (for measuring my performance) which places the gain at a lower 25.6% year over year as the January opening price was lower than the December 31 close. Either way this was a successful recommendation.

Facebook Stock will outpace the market (it closed last year at $131/share)

Facebook, like Tesla, has many critics regarding its stock. In 2018 this led to a 28% decline in the stock. The problem for the critics is that it keeps turning out very strong financial numbers and eventually the stock price has to recognize that. It appears that 2019 revenue will be up roughly 30% over 2018. After several quarters of extraordinary expenses, the company returned to “normal” earnings levels of about 35% of revenue in the September quarter. I expect Q4 to be at a similar or even stronger profit level as it is the seasonally strongest quarter of the year given the company’s ability to charge high Christmas season advertising rates. As a result, the stock has had a banner year increasing to $205/share at year-end up 57% over the prior year’s close making this pick one of my three major winners.

Amazon Stock will outpace the market (it opened the year at $1502/share)

Amazon had another very solid growth year and the stock kept pace with its growth. Revenue will be up about 20% over 2018 and gross margins remain in the 40% range. For Amazon, Q4 is a wildly seasonal quarter where revenue could jump by close to 30% sequentially. While the incremental revenue tends to have gross margins in the 25% – 30% range as it is heavily driven by ecommerce, the company could post a solid profit increase over Q3. The stock pretty much followed revenue growth, posting a 23% year over year gain closing the year at $1848 per share. I view this as another winner, but it slightly under-performed the S&P index.

Stitch Fix stock appreciation will outpace the market (it closed last year at $17/share)

Stitch Fix, unlike many of the recent IPO companies, has shown an ability to balance growth and earnings. In its fiscal year ending in July, year over year growth increased from 26% in FY 2018 to over 28% in FY 2019 (although without the extra week in Q4 of FY 2019 year over year growth would have been about the same as the prior year). For fiscal 2020, the company guidance is for 23% – 25% revenue growth after adjusting for the extra week in Q4 of FY 2019. On December 9th, Stitch Fix reported Q1 results that exceeded market expectations. The stock reacted well ending the year at $25.66 per share and the year over year gain in calendar 2019 moved to a stellar level of 51% over the 2018 closing price.

DocuSign stock will outpace the market in 2019 (it is currently at $43/share and opened the year at $41)

DocuSign continued to execute well throughout calendar 2019. On December 5th it reported 40% revenue growth in its October quarter, exceeding analyst expectations. Given this momentum, DocuSign stock was the largest gainer among our 5 picks at 72% for the year ending at just over $74 per share (since this was a new recommendation, I used the higher $43 price at the time of the post to measure performance). The company also gave evidence that it is reducing losses and not burning cash. Since ~95% of its revenue is subscription, the company is able to maintain close to 80% gross margin (on a proforma basis) and is well positioned to continue to drive growth. But, remember that growth declines for very high growth companies so I would expect somewhat slower growth than 40% in 2020.

Replacing cashiers with technology will be proven out in 2019

A year ago, I emphasized that Amazon was in the early experimental phase of its Go Stores which are essentially cashierless using technology to record purchases and to bill for them. The company now has opened or announced 21 of these stores. The pace is slower than I expected as Amazon is still optimizing the experience and lowering the cost of the technology. Now, according to Bloomberg, the company appears ready to:

  • Open larger format supermarkets using the technology
  • Increase the pace of adding smaller format locations
  • Begin licensing the technology to other retailers, replicating the strategy it deployed in rolling out Amazon Web Services to others

Replacing cooks, baristas, and waitstaff with robots will begin to be proven in 2019

The rise of the robots for replacing baristas, cooks and waitstaff did indeed accelerate in 2019. In the coffee arena, Briggo now has robots making coffee in 7 locations (soon to be in SFO and already in the Austin Airport), Café X robotic coffee makers are now in 3 locations, and there are even other robots making coffee in Russia (GBL Robotics), Australia (Aabak) and Japan (HIS Co). There is similar expansion of robotic pizza and burger cooks from players like Zume Pizza and Creator and numerous robots now serving food. This emerging trend has been proven to work. As the cost of robots decline and minimum wage rises there will be further expansion of this usage including franchise approaches that might start in 2020.

Influencers will be increasingly utilized to directly drive commerce

The use of influencers to drive commerce accelerated in 2019. Possibly the most important development in the arena was the April 2019 launch by Instagram of social commerce. Instagram now let’s influencers use the app to tag and sell products directly, that is, their posts can be “shoppable”. Part of the series of steps Instagram took was adding “checkout” which lets customers purchase products without leaving the walls of the app.

A second increase in the trend is for major influencers to own a portion of companies that depend on their influence to drive a large volume of traffic. In that way they can capture more of the value of their immense influence. Using this concept, Rihanna has become the wealthiest female musician in the world at an estimated net worth of $600 million. The vast majority of her wealth is from ownership in companies where she uses her influence to drive revenue. The two primary ones are Fenty Beauty and Fenty Maison. Fenty Beauty was launched in late 2017 and appears to be valued at over $3 billion. Rihanna owns 15% – do the math! Fenty Maison is a partnership between LVMH (the largest luxury brand owner) and Rihanna announced in May of 2019. It is targeting fashion products and marks the first time the luxury conglomerate has launched a fashion brand from scratch since 1987. Rihanna has more than 70 million followers on Instagram and this clearly establishes her as someone who can influence commerce.

The Cannabis Sector should show substantial gains in 2019

The accuracy of this forecast was a mixed bag as the key companies grew revenue at extremely high rates, but their stock valuations declined resulting in poor performance of the cannabis index (which I had said should be a barometer). A few examples of the performance of the largest public companies in the sector are shown in Table 2.

Table 2: Performance of Largest Public Cannabis Companies

*Note: Canopy last quarter was Sept 2019

In each case, the last reported quarter was calendar Q3. For Tilray, I subtracted the revenue from its acquisition of Manitoba Harvest so that the growth shown is organic growth. I consider this forecast a hit and a miss as I was correct regarding revenue (it was up an average of 282%) but the stocks did not follow suit, even modestly, as the average of the three was a decline of 54%. While my forecast was not for any individual company or stock in the sector, it was wrong regarding the stocks but right regarding company growth. The conclusion is humbling as I’m glad that I exercised constraint in not investing in a sector where I do not have solid knowledge of the way the stocks might perform.

2019 will be the year of the unicorn IPO

This proved true as many of the largest unicorns went public in 2019. Some of the most famous ones included on the list are: Beyond Meat, Chewy, Lyft, Peloton, Pinterest, Slack, The Real Real, Uber and Zoom. Of the 9 shown, four had initial valuations between $8 billion and $12 billion, two over $20 billion and Uber was the highest at an $82 billion valuation. Some unicorns found the public markets not as accepting of losses as the private market, with Lyft and Uber stock coming under considerable pressure and WeWork unable to find public buyers of its stock leading to a failed IPO and shakeup of company management. There is more to come in 2020 including another mega one: Airbnb.

2020 Predictions coming soon

Stay tuned for my top ten predictions for 2020…but please note that all 5 of the stocks recommended for 2019 will remain on the list.

Soundbyte

  • Before the basketball season began, I had a post predicting that the Warriors still had a reasonable chance to make the playoffs (if Klay returned in late February). Talk about feeling humble! I guess, counting this I had 3 misses on my predictions.

Calculating and Acting on the Right KPIs is Critical for Success

Advanced metrics for Customer Acquisition Cost (CAC) and Lifetime Value (LTV)

What is the purpose of CAC, LTV and Payback Period?

Often entrepreneurs we meet have a list of their KPI’s, but as we dig deeper, it becomes clear that they don’t fully comprehend the purpose of the KPI or why we think that they are so critical in helping us understand the health of a business. I’m a believer in thoroughly understanding the economics of your business, and the metrics around Customer Acquisition Cost (CAC), Customer Lifetime Revenue (LTR), Customer Lifetime Value (LTV) and Payback Period are important metrics to work on improving. In this post we use the word customer to mean a ‘buyer’, someone who actually orders product and will use customer and buyer interchangeably.

  • LTR (Customer Lifetime Revenue) is the total revenue from a customer over their estimated lifetime (we prefer using 5 years as representing lifetime)
  • MCA (Marketing Spend for Customer Acquisition) is the marketing cost directed towards new customer acquisition
  • CAC (Customer Acquisition Cost) captures the cost of acquiring a new buyer
  • LTV (Customer Lifetime Value) is the estimated lifetime profits on new customers once they have been acquired
  • Net LTV is the estimated lifetime profits on a new customer taking acquisition cost into account or: LTV – CAC
  • Payback Period is the time for a new customer to generate profits that equals his or her CAC

When LTV is compared to CAC a measure of the future health of the business can be seen. Most VCs will be loath to invest in any company where the ratio of LTV/CAC is less than 3X and enthusiastic when it exceeds 5X. I also favor companies with a short payback period especially if the recovery is from the first transaction as this means almost no cash is consumed when acquiring a customer.

I have previously written about Contribution Margin (gross margin less marketing and sales spend) being one of the most important metrics for companies as it tells me how scaling revenue will help cover G&A and R&D costs. Once Contribution Margin exceeds these costs there is operating profit. A company with low Contribution Margin needs much greater scale to be able to reach profitability than one with high Contribution Margin. Both the LTV/CAC ratio and Payback Period are important predictors of future Contribution Margin levels. Table 1 shows two companies with the same revenue, R&D and G&A cost. Assuming R&D and G&A are fixed for both, at 5% Contribution Margin Company A would need to reach $50 million in revenue to break-even while Company B would be at break-even at under $4 million in revenue given its 65% Contribution Margin.

Break Even Revenue = (R&D + G&A)/ (Contribution Margin %)

For Company A = $2,500,000/ (5%) = $50,000,000

For Company B = $2,500,000/ (65%) = $3,846,154

The problem for Company A stems from the fact that for every $40 spent in acquiring a customer the total LTV (or subsequent profits on the customer) is only $76 making Net LTV $36. With such a low ratio of LTV/CAC, Contribution Margin is also quite low. I’ve chosen two extremes in gross margin to better illustrate the impact of gross margin on Contribution Margin. 

Table 1: Illustrative Example on the Importance of Contribution Margin

In a second example, Table 2, we show the impact of much more efficient marketing and remarketing on a company’s results. We assume gross margin, R&D and G&A are the same for Company C and Company D, but that Company D is much more efficient at acquiring and retaining customers, resulting in a lower CAC and a higher LTR and LTV for Company D. This could be due to higher spending on branding and remarketing, but also because they are very focused on the metrics that help them optimize acquisition and LTR. The result is considerably higher LTV/CAC and significantly higher Contribution Margin. 

Table 2: Impact of Efficient Marketing & Remarketing on a Company’s Results

A few rules regarding Contribution Margin

  1. Higher Gross Margin means greater opportunity for high Contribution Margin – for example, Company A at 20% Gross Margin is severely limited in reaching a reasonable Contribution Margin while Company B at 80% Gross Margin has an opportunity for high Contribution Margin and can reach profitability at lower revenue levels
  2. Companies with many new customers acquired through “free” methods like SEO, viral marketing, etc. have higher Contribution Margins than similar companies with a low proportion of free acquisitions.  Notice Company D can spend less on marketing than Company C because it acquires half of its customers from free sources whereas Company C has none from free sources.
  3. Returning buyers contribute heavily to Contribution Margin since they require little if any marketing cost. A high LTV/CAC ratio usually means customers return more often, which in turn should increase future Contribution Margin. Company D with its very high LTV/CAC likely has much lower churn than Company C and therefore most of its marketing spend is for adding incremental customers rather than just replacing those that churn. If a company simply stopped spending on marketing, its revenue would be from existing customers and new customers acquired from free methods making Contribution Margin roughly equal to Gross Margin. Of course, lack of marketing could have a major impact on future growth
  4. All other things being equal, companies with short Payback Periods tend to have higher Contribution Margin than those with longer Payback Periods

Marketing Spend on Branding versus Customer Acquisition

Branding is the communication of characteristics, values and attributes of an organization and its products. What is the purpose of spending on branding?  To create a strong image of the company and its products so that existing customers want to stay and spending on customer acquisition will be more efficient. Great brands should have a lower CAC and higher LTV than weak brands.

Nike’s “Just Do It” campaign worked well in establishing a brand message that resonated. Their more recent campaign centered around Colin Kaepernick was riskier as it had pictures of the quarterback and the slogan: “Believe in something even if it means sacrificing everything”. While Kaepernick is controversial, he appeals to a large part of the Nike existing and potential buying audience. The campaign helped lift sales by 27% in the first 4 days following the ad launch. Karen McFarlane, founder Kaye Media Partners summed up Nike’s strategy: “Nike’s mission is to bring inspiration and innovation to every athlete in the world. Colin Kaepernick, through his advocacy, conviction, and talent on and off the field, exemplifies those values in the strongest of terms. Couple that with Nike’s commitment to diversity and community, particularly against the backdrop of today’s America where politics have amplified cultural divisions, Nike took the opportunity to lean into their mission and values.”

Marketing campaigns that are for direct customer acquisition differ from branding campaigns as their goal is to directly acquire customers. It is not always clear whether marketing dollars should be classified as acquisition or branding. The key point is that branding is building for the future, whereas acquisition campaigns are measured by how efficiently they deliver current customers. This brings us back to measuring CAC, as the question becomes whether branding campaigns are part of the calculation of CAC. I believe they are not, as CAC should represent the direct cost of acquiring a customer so that increasing that spend will allow us to estimate how many more customers will result. So, I conclude that marketing for branding should be excluded from the calculation of CAC but can be an important strategy to improve efficiency in acquiring customers and maximizing their value. It should be part of the Contribution Margin calculation.

Paid CAC vs Blended CAC

If CAC represents what it costs to acquire a customer, what about those customers that are acquired through SEO, viral marketing, or some other free method? If one simply divides the spend on Marketing for Customer Acquisition (or MCA) by the total number of new customers, the result will be deceptive if it is used to estimate how many more customers will be acquired if MCA spend is increased. Instead companies should calculate CAC in two ways:

Blended CAC = MCA/ (total number of new customers)

Acquisition CAC = MCA/ (number of new customers generated from acquisition marketing only)

Attribution Models and how they help understand CAC by Channel

CAC helps predict the impact of different levels of spending on marketing. Companies also need to know where spending has the best impact, and therefore need to calculate a CAC (and LTV) for each channel of marketing. If a company uses multiple channels like Facebook, Google, and Snap they need to assign credit to each channel for the customers generated from that channel as compared to the spend for that channel to determine the channel CAC. The most simplistic way of doing this is to say, for example, that Google advertising gets credit for the customer if the purchase by the customer occurs after clicking to the site from Google. But what if a consumer sees a Facebook ad, goes to the site to look at products, then a week later comes back to the site from a Snap ad, and then visits the site again because the company sent them an email that they click on, and finally buys something after clicking on a Google ad?  Should Google get the entire credit for the customer?

Attribution models from companies like Amplitude and Hive attempt to appropriately credit each channel touchpoint for the role it played in acquiring a customer. For example, a company might assign 50% of the credit to the last touchpoint and divide the other 50% equally among prior touchpoints or use some other formula that is believed to capture how each channel participated in driving that consumer towards a purchase. Attribution models attempt to help companies understand how scaling spend in each channel will impact customer acquisition. For example:

Google CAC = (Google marketing spend)/ (number of customers attributed to Google ads)

One question that arises when using attribution models to credit each channel is whether “free” areas should share the credit when both paid and free touchpoints occur before converting a consumer into a buyer. The issue is whether the free touchpoints would have occurred had the company not spent on paid marketing. In my prior example the customer would never have received an email from the company had they not first seen the Facebook and Snap ads so eliminating these ads would also eliminate the email which in turn probably means they never would have become a customer. In a similar way, someone who clicked on a Google ad but did not buy, might later do a search for the product, and go to the site from SEO and then buy. So, one method of assigning attribution would be to divide the entire attribution among paid channels if a consumer touched both paid and free ones before becoming a customer. If the consumer only went to free channels, then they would count in blended CAC but not as a customer in calculating paid CAC or CAC by paid channel.

Where does Marketing to an existing customer fit in?

CAC is meant to measure new customer acquisition. So, marketing to an existing customer to get them to buy more should not be part of CAC but rather should be subtracted from MCA. I view it as a cost that reduces Lifetime Value (LTV). Many startups ignore the possibility of “reactivating” churned customers through marketing spend. Several Azure portfolio companies have seen success in deploying a reactivation strategy. I consider this spend as marketing to an existing customer and resulting profits an increase in LTV. Revising the definition of LTV (see Table 1):

LTV = LTR – COGS – Marketing Costs to existing customers

MCA (Marketing Cost for Customer Acquisition) = Marketing Costs – branding costs – marketing to existing customers

In Table 1, remarketing expense is 1% of Lifetime revenue for both Company A and Company B or:

Company A LTV = (GM% – remarketing%) X LTR = (20% – 1%) X $400 = $76

Company B LTV = (80%– 1%) X $400 = $316

What about new customers that return the product?

This is a thorny issue. If a consumer buys their first product from a company and then returns it, is she a customer? I think it would not be wrong with interpreting this either way. But I prefer considering her a customer as she was a buyer, and while the return zeros out the revenue from that purchase, she did become a customer. There is ample opportunity for marketing to her again. Considering her a customer lowers CAC as there are more customers for the spend, but it also lowers LTV for the same reason. So, if the interpretation is applied consistently over both CAC and LTV, I believe it would be correct.

More mature companies should apply the methods shown here to better understand their business

By better understanding acquisition CAC and LTV of each channel of customer acquisition a company can direct more spending to the most efficient ones (those with the highest LTV/CAC). By experimenting with “reactivation” spending a company can determine if this improves LTV/CAC. Companies that improve LTV/CAC will likely generate higher Contribution Margin. Those that increase the proportion of customers acquired for “free” can also improve Contribution Margin. Improving CAC and LTV can be accomplished in several ways as described in prior posts:

Optimizing the cost of customer acquisition modeling metrics to drive startup success (March 2014)

How to improve Contribution Margin (Nov 2018)

Without proper metrics a company is essentially flying blind and will be far less likely to succeed. This post provides a blueprint towards a more sophisticated approach to understanding any business.

Defining Key Elements of the New Model for Retail

In our October, 2015 Soundbytes (https://soundbytes2.com/2015/10/)  I predicted that Omnichannel selling would become prevalent over the ensuing years with brick and mortar retailers being forced to offer an online solution, ecommerce companies needing to access buyers at physical locations and online brands (referred to as DTC or direct to consumer) being carried by 3rd party physical stores. Since that post, these trends have accelerated (including Amazon’s announcement last week that it is opening another “4-star store” in the bay area). Having had more time to observe this progression, I have developed several theories regarding this evolving new world that I would like to share in this post.  

Issues for Brick and Mortar Stores when they Create an Online Presence

Physical retailers are not set up to handle volumes of online sales. Their distribution centers are geared towards sending larger volumes of products to their stores rather than having the technology and know-how to deal directly with consumers (a situation which motivated Walmart to buy Jet for $3.3 billion). In general, a retailer starting to sell online will need to create one or more new distribution centers that are geared towards satisfying direct to consumer online demand.  

Another rude awakening for brick and mortar retailers when they go online is a dramatic increase in returns. On average, returns are about 9% of purchases from a retail store and 30% when purchased online. The discrepancy is even greater for clothing (especially shoes) as fit becomes a major issue. Given that consumers expect free shipping, and most want free return shipping, this becomes a cost that can eviscerate margins. The volume of returns also creates the problem of handling reverse logistics, that is tracking the return, crediting the customer, putting it back into the inventory system as available and restocking it into the appropriate bin location. Then there is the question as to whether the item can still be resold. For clothing this may require adding the cost of cleaning and pressing operations to keep the item fresh and having the systems to track movement of the inventory through this process.

Lastly, the question becomes whether a brick and mortar retailers’ online sales will (at least partly) cannibalize their in-store sales. If so, this, coupled with the growth of online buying, can make existing store footprints too large, reducing store profits.

If Brick and Mortar Retailers Struggle with an Omnichannel Approach, why do DTC Brands Want to Create an Offline Presence?

The answer is a pretty simple one: market access and customer acquisition.  Despite a steady gain of share for online sales, brick and mortar still accounts for over 70% of consumer purchases. Not too long ago, Facebook was a pretty efficient channel to acquire customers. For the past 5 years, Azure portfolio companies have experienced a steep rise in CAC (customer acquisition cost) when using Facebook as the acquisition vehicle. There are many theories as to why, but it seems obvious to me that it is simply the law of supply versus demand. Facebook usage growth has slowed but the demand for ad inventory has increased dramatically, driving up prices. For large brands that use advertising for brand building rather than customer acquisition this does not appear to be a problem, especially when comparing its value to ads on television. For brands that use it for customer acquisition, doubling CAC changes the ratio of LTV (lifetime value or lifetime profits on a customer) to CAC making this method of customer acquisition far less effective.

The combination of these factors has led larger (and smaller) online brands to open brick and mortar outlets. Players like Warby Parker, Casper, Bonobos and even Tesla have done it by creating stores that are a different experience than traditional retail. Warby Parker, Bonobos and Tesla do not stock inventory but rather use the presence to attract customers and enable them to try on/test drive their products. I have bought products, essentially online, while at Warby Parker and Tesla physical locations.

I then had to wait between 2 to 6 weeks for the product to be manufactured and delivered (see the soundbite on Tesla below). What this means in each of their cases is that they kept their business models as ones of “manufacture to demand” rather than build to inventory.  It seems clear that for all four of the companies cited above there is a belief that these physical outlets are a cost effective way of attracting customers with a CAC that is competitive to online ads. They also effectively use online follow-up once you have visited their brick and mortar outlet, thus creating a blend of the two methods. Once the customer is acquired, repeat purchases may occur directly online or in a combination of online and offline.

The Future Blend of Online/Offline

While we have seen a steady progression of companies experimenting with Omnichannel whether they started as offline or online players, we have yet to see an optimal solution. Rather, various players have demonstrated parts of that optimization. So, I’d like to outline a few thoughts regarding what steps might lead to more optimization:

  1. To the degree possible, online purchases by consumers should have an in-store pickup and review option at some savings versus shipping to the home. For clothing, there should also be an opportunity to try the online purchased items on before leaving the store. In that way consumers have the ability to buy online, coupled with the convenience of trying products on in a store. This would expose the customer to a broader set of inventory (online) than even a large footprint store might be able to carry. It would improve fit, lower cost to the brand (by lowering returns and reducing shipping cost) while allowing the brand to begin acquiring better information on fit – insuring an improvement for the next online purchase. A secondary benefit would be the increase in store traffic that was created.
  2. Many retailers will add Rental to the mix of options offered to customers to improve profits. Azure portfolio company, Le Tote, is a subscription rental company for everyday women’s clothes. As women give feedback on a large variety of aspects of fit and preferences it can improve the fit dramatically with each successive box. Retailers need to have systems that replicates this knowledge of their customers. The problem for pure brick and mortar retailers is that they have not had a relationship that enables them to get the feedback…and they don’t have software systems to build this knowledge even if they were to get it. Le Tote has also built up strong knowledge of women’s preferences as to style and has created successful house brands that leverage that knowledge based on massive feedback from subscribers. You may have seen the announcement that Le Tote has just acquired Lord & Taylor, the oldest department store in the country. It plans to use the millions of existing Lord & Taylor customers as a source of potential subscribers to its service. It also has a rental vehicle that can be used to improve monetization of items that don’t sell through at the stores.
  3. Successful online brands will be carried by offline retailers. This has already started to occur but will accelerate over time as DTC brands like Le Tote (and perhaps Stitchfix) use their tens of millions of specific customer feedback data points to produce products that meet the needs expressed in the feedback. If they have correctly mined the data, these brands should be quite successful in offline stores, whether it be their own or a third party retailers’ outlet. The benefit to the retailor in carrying online brands is two-fold: first the online brands that have effectively analyzed their data create products they know can sell in each geography; and second carrying online brands will improve the image of the retailor in the eyes of shoppers who view DTC companies as more forward thinking.
  4. Department store footprints will need to shrink or be shared with online players. The issue discussed earlier of overall ecommerce coupled with brick and mortar stores cannibalizing store demand when they start selling online can be dramatically mitigated by having smaller stores. In that way retailers can maintain their brand presence, continue to get foot traffic, and improve store efficiency.  Any larger footprint store may need to take part of its space and either sublet it (as Macys is doing in some locations) or attract online brands that are willing to pay for a presence in those stores in the form of a percentage of revenue generated or rent. The offer to DTC brands may be to have a pop-up for a set period, or to agree to a longer-term relationship. By working with DTC brands in this way retailers can improve gross margin per square foot (a critical KPI for brick and mortar players) for poorly utilized portions of their store footprints. The secondary benefit to the retailer would be that the online brands will generate additional traffic to the stores. There are already a few startups that are creating a store within a store concept that carries DTC brands. They hope to be the middleman between DTC brands and large retailers/shopping malls making it easier for the DTC brands to penetrate more locations, and easier for the retailer to deal with one new player that will install multiple DTC brands in their locations.
  5. There will be more combinations of online and offline companies merging. By doing that the expertise needed for each area of the business can be optimized. The online companies presumably have better software, logistics and more efficient methods of acquiring online customers. The brick and mortar retailers have greater knowledge of running a physical store, an existing footprint to carry the online brands, locations that allow for delivery to their stores, and a customer base to market to online (reducing the CAC and increasing LTV).
  6. For Omnichannel companies, revenue attribution is complex but becomes essential to managing where dollars are spent. Revenue attribution is the tracking, connecting, and crediting marketing efforts to their downstream revenue creation. For example, if a potential customer responds to a Facebook ad by going online to look at items, then visits a store to check them out live, but eventually buys one or more of the items in response to a google ad, the question becomes: which channel should get credit for acquiring the customer? This is important as the answer may impact company strategy and help determine where marketing dollars get spent. Several Azure portfolio companies are now using 3rd party software from companies like Hive to appropriately give attribution to each channel that helped contribute to the eventual sale. This process is important as it helps determine future spending. We expect better run Omnichannel companies to evolve their analysis of marketing to include attribution models.  

Conclusion: The future winners in retail will be those that successfully migrate to the most optimal omnichannel models

What I have described in this post is inevitable. Some large proportion of customers will always want to do some or all of their shopping at a brick & mortar store. By blending the positive attributes of physical retail with the accessibility to the larger number of options that can exist online, companies can move to more optimal models that address all potential customers. But unless this is done in an intelligent way booby traps like inefficient floor space, excessive returns, high shipping costs and more will rear their ugly heads. This post describes steps for retailers/brands to take that are a starting point for optimizing an omnichannel approach.  

Soundbytes

  • When I had just left Wall Street, I received calls from the press and a very large investor in Hewlett Packard regarding my opinion of the proposed acquisition of Compaq Computer. I said: “HP is in 6 business areas with Imaging being their best and PCs their worst. Doubling up on the worst of the 6 does not make sense to me.” When asked what they should do instead, I replied: “Double up on the best business: acquire Xerox.” My how the tide has turned as Xerox was in trouble then and could have been bought at a very low price. Now it appears Xerox may acquire HP. To be clear, Xerox is still a much smaller market cap company…but I’m enjoying seeing how this process will work out.

  • In the last Soundbytes, I mentioned that I had purchased a Tesla Model 3. What is interesting is that 6 weeks later I am being told that it may take as long as 3-4 more weeks before I receive the car.  This means delivery times have extended to at least 9 weeks. I can’t say how reliable this is but the salesperson I am dealing with told me that Tesla has prioritized production of Model S, Model X and shipments to Europe and Asia over even the more expensive versions of Model 3’s (mine cost almost $59,000 before sales tax). One can easily conclude that production must be at full capacity and that the mix this quarter will contain more higher priced cars. So, demand in the quarter appears to be in excess of 100,000 units and price per car appears strong. Assuming the combination of maximum production in the U.S. and some production out of the Chinese factory, supply might also exceed 100,000 units. If the supply is available, then Tesla should have a strong Q4. However, there is the risk that Tesla doesn’t have the parts to supply both factories or that they have somehow become less efficient. The latest thing to drive down the Tesla stock price is the missteps in showcasing the new truck. I’m not sure why a company should be castigated for an esoteric feature not working in a prototype of a product that won’t be in production until sometime in 2021. Remember, Tesla at its core is a technology company producing next gen autos. I’ve seen other technology companies like Microsoft and Oracle have glitches in demos of future products without such a reaction. As for the design of the truck, I believe Tesla is targeting a 10% to 20% share of the truck market with a differentiated product rather than attempting to attract all potential buyers. 10% of the U.S. pickup market would result in 250,000 units per year. The company has announced pre-orders for the vehicle have already reached 200,000. If these orders are real, they have a home run on their hands but since the deposit is only $100 there is no guarantee that all deposits will convert to actual purchases when the truck goes into production.  

Comparing Recent IPO Companies – Should Performance Drive Valuation?

In a past life, while on Wall Street, one of my favorite calls was: “Buy Dell Short Kellogg”. My reasoning behind the call was that while Dell’s revenue and earnings growth was more than 10X that of Kellogg, somehow Kellogg had a much higher PE than Dell. Portfolio managers gave me various reasons they claimed were logical to explain the un-logical situation like: “Kellogg is more reliable at meeting earnings expectations” …. when in truth they had missed estimates 20 straight quarters. What I later came to believe was that the explanation was their overall comfort level with Kellogg because they understood cereal better than they understood a direct marketing PC hardware company at the time. My call worked out well as Dell not only had a revenue CAGR of nearly 50% from January 1995 (FY 95) through January of 2000 (and a 69% EPS CAGR) but also experienced significant multiple expansion while Kellogg revenue grew at just over 1% annually during the ensuing period and its earnings shrunk (as spend was against missed revenue expectations). The success of Dell was a major reason I was subsequently selected as the number one stock picker across Wall Street analysts for 2 years in a row.

I bring up history because history repeats. One of the reasons for my success in investing is that I look at metrics as a basis of long-term valuation. This means ignoring story lines of why the future is much brighter for those with weak metrics or rationales of why disaster will befall a company that has strong results. Of course, I also consider the strength of management, competitive advantages and market size. But one key thesis that comes after studying hundreds of “growth” companies over time is that momentum tends to persist, and strong business models will show solid contribution margin as an indicator of future profitability.

Given this preamble I’ll be comparing two companies that have recently IPO’d. Much like those that supported Kellogg, the supporters of the one with the weaker metrics will have many reasons why it trades at a much higher multiple (of revenue and gross margin dollars) than the one with stronger metrics.  

Based on financial theory, companies should be valued based on future cash flows. When a company is at a relatively mature stage, earnings and earnings growth will tend to be the proxy used and a company with higher growth usually trades at a higher multiple of earnings.   Since many companies that IPO have little or no earnings, many investors use a multiple of revenue to value them but I prefer to use gross margin or contribution margin (where marketing cost is broken out clearly) as a proxy for potential earnings as they are much better indicators of what portion of revenue can potentially translate to future earnings (see our previous post for valuation methodology).

I would like to hold off on naming the companies so readers can look at the metrics with an unbiased view (which is what I try to do). So, let’s refer to them as Company A and Company B. Table 1 shows their recent metrics.

Notes:

  • Growth for Company B included an extra week in the quarter. I estimate growth would have been about 27% year/year without the extra week
  • Disclosures on marketing seem inexact so these are estimates I believe to be materially correct
  • Pre-tax income for Company A is from prior quarter as the June quarter had considerable one-time expenses that would make it appear much worse

Company B is:

  1. Growing 2 -2 ½ times faster
  2. Has over 3X the gross margin percentage
  3. Over 28% contribution margin whereas Company A contribution margin is roughly at 0
  4. Company B is bordering on profitability already whereas Company A appears years away

Yet, Company A is trading at roughly 3.5X the multiple of revenue and almost 11X the multiple of gross margin dollars (I could not use multiple of contribution margin as Company A was too close to zero). In fairness to Company A, its gross margin was much higher in the prior quarter (at 27%). But even giving it the benefit of this higher number, Company B gross margins were still about 65% higher than Company A.

The apparent illogic in this comparison is much like what we saw when comparing Kellogg to Dell many years ago. The reasons for it are similar: investors, in general, feel more comfortable with Company A than they do with Company B. Additionally, Company A has a “story” on why things will change radically in the future. You may have guessed already that Company A is Uber. Company B is Stitchfix, and despite its moving to an industry leading position for buying clothing at home (using data science to customize each offering) there continues to be fear that Amazon will overwhelm it sometime in the future. While Uber stock has declined about 35% since it peaked in late June it still appears out of sync compared to Stitchfix.

I am a believer that, in general, performance should drive valuation, and have profited greatly by investing in companies that are growing at a healthy rate, appear to have a likelihood of continuing to do so in the near future and have metrics that indicate they are undervalued.

Soundbytes

  • It appears that many others are now beginning to focus more closely on gross margins which we have been doing for years. I would encourage a shift to contribution margin, where possible, as this considers the variable cost needed to acquire customers.
  • A few notes about Tesla following our 2019 predictions: My household is about to become a two Tesla family. My wife has owned her second Tesla, a Model S, for over 4 years and I just placed an order to buy a Model 3 as a replacement for my Mercedes 550S. Besides the obvious benefits to the environment, I’m also tired of having to go to gas stations every week. The Model 3 can go 310 miles on a charge, is extremely fast, has a great user interface and has autopilot. I looked at several other cars but found it hard to justify paying twice as much (or more) for a car with less pickup, inferior electronics, etc.
  • If you were wondering why Tesla stock has gone on a run it is because the Chinese Ministry of Industry and Information Technology (MIIT) has added Tesla to its list of approved auto manufacturers (the news of the possibility broke over a week ago). It appears likely that Tesla will begin producing Model 3s out of the new Giga Factory in China some time in Q4. This not only adds capacity for Tesla to increase its unit sales substantially in 2020 but also will save the Company considerable money as it won’t need to ship cars from its US factory. Remember Tesla also is planning on a Giga Factory in Europe to service strong demand there. The company has said that it will choose the location by the end of 2019. Given the intense competition to be the selected location, it is likely that the site chosen will involve substantial incentives to Tesla. While I would not want to predict when it will be in production, Elon Musk expects the date to be sometime in 2021. Various announcements along the way could be positive for Tesla stock.

Why Apple Acquiring Tesla Seems an Obvious Step…

…and why the obvious probably won’t happen!

A Look at Apple history

Apple’s progress from a company in trouble to becoming the first company to reach a trillion dollar market cap meant over 400X appreciation in Apple stock. The metamorphosis began when the company hired Fred Anderson as an Executive VP and CFO in 1996. Tim Cook joined the company as senior VP of worldwide operations in 1998. Fred and Tim improved the company operationally, eliminating wasteful spending that preceded their tenure. Of course, as most of you undoubtedly know, bringing back Steve Jobs by acquiring his company, NeXT Computer in early 1997 added a strategic genius and great marketer to an Apple that now had an improved business model. Virtually every successful current Apple product was conceived while Steve was there. After Fred retired in 2004, Tim Cook assumed even more of a leadership role than before and eventually became CEO shortly before Jobs’ death in 2011.  

Apple post Steve Jobs

Tim Cook is a great operator. In the years following the death of Steve Jobs he squeezed every bit of profit that is possible out of the iPad, iPod, iMacs, music content, app store sales and most of all the iPhone. Because great products have a long life cycle they can increase in sales for many years before flattening out and then declining.

Table 1: Illustrative Sales Lifecycle for Great Tech Product

Cook’s limit is that he cannot conceptualize new products in the way Steve Jobs did. After all, who, besides an Elon Musk, could? The problem for Apple is that if it is to return to double digit growth, it needs a really large, successful new product as the iPhone is flattening in sales and the Apple Watch and other new initiatives have not sufficiently moved the needle to offset it. Assuming Q4 revenue growth in FY 2019 is consistent with the first 9 months, then Apple’s compound growth over the 4 years from FY 15 to FY 19 will be 3.0% (see Table 2) including the benefit of acquisitions like Beats.

iPhone sales have flattened

The problem for Apple is that the iPhone is now in the mature part of its sales life cycle. In fact, unit sales appear to be declining (Graph 1) but Apple’s near monopoly pricing power has allowed it to defy the typical price cycle for technology products where average selling prices decline over time. The iPhone has gone from a price range of $99 to $299 in June 2009 to $999 to $1449 for the iPhoneX, while the older iPhone 7 is still available with minimal storage for $449. That’s a 4.5X price increase at the bottom and nearly 5X at the high end! This defies gravity for technology products.

Graph 1: iPhone Unit Sales (2007-2018)

In the many years I followed the PC market, it kept growing until reaching the following set of conditions (which the iPhone now also faces):

  1. Improvements in features were no longer enough to drive rapid replacement cycles
  2. Pricing was under pressure as component costs declined and it became more difficult to convince buyers to add capacity or capability sufficient to hold prices where they were
  3. The number of first time users available to buy product was no longer increasing each year
  4. Competition from lower priced suppliers created pricing pressure

Prior to that time PC pricing could be maintained by convincing buyers that they needed one or more of:

  1. The next generation of processor
  2. A larger or thinner screen
  3. Next generation storage technology

What is interesting when we contrast this with iPhones is that PC manufacturers struggled to maintain average selling prices (ASPs) until they finally began declining in the early 2000s. Similarly, products like DVD players, VCRs, LCD TVs and almost every other technology driven product had to drop dramatically in price to attract a mass market. In contrast to that, Apple has been able to increase average prices at  the same time that the iPhone became a mass market product. This helped Apple postpone the inevitable revenue flattening and subsequent decline due to lengthening replacement cycles and fewer first time buyers. In the past few years, other then the bump in FY 2018 from the launch of the high priced Model X early that fiscal year, iPhone revenue has essentially been flat to down. Since it is well over 50% of Apple revenue, this puts great pressure on overall revenue growth.

To get back to double digit growth Apple needs to enter a really large market

To be clear, Apple is likely to continue to be a successful, highly profitable company for many years even if it does not make any dramatic acquisitions. While its growth may be slow, its after tax profits has been above 20% for each of the past 5 years. Strong cash flow has enabled the company to buy back stock and to support increasing dividends every year since August 2014.

Despite this, I think Apple would be well served by using a portion of their cash to make an acquisition that enables them to enter a very large market with a product that already has a great brand, traction, and superior technology. This could protect them if the iPhone enters the downside of its revenue generating cycle (and it is starting to feel that will happen sometime in the next few years). Further, Apple would benefit if the company they acquired had a visionary leader who could be the new “Steve Jobs” for Apple.

There is no better opportunity than autos

If Apple laid out criteria for what sector to target, they might want to:

  1. Find a sector that is at least hundreds of billions of dollars in size
  2. Find a sector in the midst of major transition
  3. Find a sector where market share is widely spread
  4. Find a sector ripe for disruption where the vast majority of participants are “old school”

The Automobile industry matches every criterion:

Matching 1.  It is well over $3 trillion in size

Matching 2. Cars are transitioning to electric from gas and are becoming the next technology platform

Matching 3. Eight players have between 5% and 11% market share and 7 more between 2% and 5%

Matching 4. The top ten manufacturers all started well over 50 years ago

And no better fit for Apple than Tesla

Tesla reminds me of Apple in the late 1990s. Its advocates are passionate about the company and its products. It can charge a premium versus others because it has the best battery technology coupled with the smartest software technology. The company also designs its cars from the ground up, rather than retrofitting older models, focusing on what the modern buyer would most want. Like Jobs was at Apple, Musk cares about every detail of the product and insists on ease of use wherever possible. The business model includes owning distribution outlets much like Apple Stores have done for Apple. By owning the outlets, Tesla can control its brand image much better than any other auto manufacturer. While there has been much chatter about Google and Uber in terms of self-driving cars, Tesla is the furthest along at putting product into the market to test this technology.

Tesla may have many advantages over others, but it takes time to build up market share and the company is still around 0.5% of the market (in units). It takes several years to bring a new model to market and Tesla has yet to enter several categories. It also takes time and considerable capital to build out efficient manufacturing capability and Tesla has struggled to keep up with demand. But, the two directions that the market is moving towards are all electric cars and smart, autonomous vehicles. Tesla appears to have a multi-year lead in both. What this means is that with enough capital and strong operational direction Tesla seems poised to gain significant market share.

Apple could accelerate Tesla’s growth

If Apple acquired Tesla it could:

  1. Supply capital to accelerate launch of new models
  2. Supply capital for more factories
  3. Increase distribution by offering Tesla products in Apple Stores (this would be done virtually using large computer screens). An extra benefit from this would be adding buzz to Apple stores
  4. Supply operational knowhow that would increase Tesla efficiency
  5. Add to the luster of the Tesla brand by it being part of Apple
  6. Integrate improved entertainment product (and add subscriptions) into Tesla cars

These steps would likely drive continued high growth for Tesla. If, with this type of support, it could get to 5% share in 3-5 years that would put it around $200 billion in revenue which would be higher than the iPhone is currently. Additionally, Elon Musk is possibly the greatest innovator since Steve Jobs. As a result, Tesla would bring to Apple the best battery technology, the strongest power storage technology, and the leading solar energy company. More importantly, Apple would also gain a great innovator.

The Cost of such an acquisition is well within Apple’s means

At the end of fiscal Q3, Apple had about $95 billion in cash and equivalents plus another $116 billion in marketable securities. It also has averaged over $50 billion in after tax profits annually for the past 5 fiscal years (including the current one). Tesla market cap is about $40 billion. I’m guessing Apple could potentially acquire it for less than $60 billion (which would be a large premium over where it is trading). This would be easy for Apple to afford and would create zero dilution for Apple stockholders.

If the Fit is so strong and the means are there, why won’t it happen?

I can sum up the answer in one word – ego.  I’m not sure Tim Cook is willing to admit that Elon would be a far better strategist for Apple than him. I’m not sure he would be willing to give Elon the role of guiding Apple on the product side. I’m not sure Elon Musk is willing to admit he is not the operator that Tim Cook is (remember Steve Jobs had to find out he needed the right operating/financial partners by getting fired by Apple and essentially failing at NeXT). I’m not sure Elon is willing to give up being the CEO and controlling decision-maker for his companies.

So, this probably will never happen but if it did, I believe it would be the greatest business powerhouse in history!

Soundbytes

  1. USA Today just published a story that agreed with our last Soundbytes analysis of why Klay Thompson is underrated.
  2. I expect Zoom Video to beat revenue estimates of $129 million to $130 million for the July Quarter by about $5 million or more

The Warriors Ain’t Dead Yet!

Why the team is still a contender

My long term readers know that every so often the blog wanders into the sports arena. In doing so, I apply the same type of analysis that I do for public stocks and for VC investments to sports, and usually, basketball. Given all the turmoil that has occurred in the NBA this off-season, including the Warriors losing Durant, Iguodala, Livingston, Cousins and several other players, I thought it would be interesting to evaluate the newly changed team. Both ESPN and CBS power rankings have them 7th in the West and 11th in the NBA. I find that an overreaction as the Warriors may have beaten the Raptors if Klay Thompson not been injured, they swept Portland, and won the last 2 Rockets games without Durant. At the time this drove a lot of chatter that the team might be better off without Durant (I disagree).

But rather then compare the revised roster to last year’s, it seems more closely matched with the 2014-15 team, as that was a championship team that did not include Kevin Durant. I will make 2 key assumptions:

  1. Klay Thompson will return by the end of February and be as effective as he was before his injury
  2. The Warriors will make the playoffs despite missing Thompson for the majority of the season

It all starts with Curry

A third key assumption that has been proven over and over again is that players that come to the Warriors usually perform better as they benefit from the “Curry Effect”, namely, getting more shots without having someone closely guarding them, (The Curry Effect), resulting in an average improved shooting percentage of over 5%. In all fairness, it really is the “Curry plus Thompson Effect” as the extreme focus on preventing the two of them from taking 3 point shots is what frees up others. It helps that Curry is unselfish and readily passes the ball when he is double or triple teamed. Thompson’s passing has improved substantially but since he gets his shot off so quickly, he has less need to pass it. Last year both shot over 40% from 3 despite defensive efforts focused on preventing each of them from taking those shots.

Starting Teams: 2019-20 vs 2014-15

Table 1

Curry, Thompson and Green, the heart and soul of the Warriors, all remain from the 2014-15 roster, and now are at their peaks. In the 2014-15 season when Green first became a starter, Curry was one year away from reaching his peak and Thompson was just coming into his own especially on defense. I believe each of them is better today then they were at that time. At his best, Bogut may have been better than Cauley-Stein, but by 2014 Bogut had been through a number of injuries. Last year Cauley-Stein averaged nearly double the points of 2014 Bogut (11.9 vs 6.3), took slightly more rebounds per game and was a better free throw shooter. Stein, much like Bogut, is also considered a solid pick setter and defender. Russell is someone who should benefit greatly from playing with Curry. Even without that, last season he averaged over twice as many points per game as 2014 Barnes (21.1 vs 10.1) which should take considerable pressure off Curry (and Klay when he returns). However, Barnes was a better defender in 2014 than Russell is today. I give the edge to all 5 starters on the 2019 starting team compared to the 5 that started in 2014-15.

Thompson may be the most underrated player in the league!

It’s unfortunate that Thompson was injured in game 6 of the 2019 finals as he was once again proving just how good he can be. Not only was he playing lockdown defense, but he also drove the offense in what has been referred to as a typical Klay game 6. In just 32 minutes, before getting injured, he scored 30 points on 83% effective shooting percentage (67% on 3s), went 10 for 10 on free throws, and had 5 rebounds and 2 steals. I believe Golden State, even without Durant, would have forced a game 7 if Thompson did not get injured.

It boggles my mind that one of the websites could refer to Thompson as “an average player” who did not merit a max contract. This is bordering on the ridiculous and has a lot to do with the fact that the most important measure of shooting, effective shooting percentage (where each 3 made counts as 1½ 2 point shots made) does not normally get reported (or even noticed). In Table 2, I list the top 31 scorers from last season (everyone who averaged at least 20 points per game) and rank them by effective shooting. Thompson is number 8 in effective shooting and number 3 in 3-point percentage among this group. So, if effective shooting percentage was regularly published, Thompson would show up consistently helping the perception of his value. When this is coupled with his being a third team all-defensive player (i.e., one of the top 15 defenders in the league) it appears clear that he should be considered one of the top 15 players in the league.

Table 2: Top Scorers 2018-2019 Season

6th Man 2019-20 vs 2014-15

Kevon Looney has emerged as a potential star in the works. While he may not yet be the defensive presence of Iguodala, he is getting close. His scoring per minute played was higher than Andre’s 2014-15 numbers and his rebounds per minute were more than twice as much. While Iguodala had greater presence and could run the team as well as assist others in scoring, Looney at least partly makes up for this in his ability to set screens. Looney also has a much higher effective shooting percentage (62.7% vs 54.0%) than Andre had in 2014-15. While Kevon doesn’t shoot 3s he gets many points by putting back offensive rebounds and dunking lob passes. Overall, I give the edge to Iguodala based on the Looney of last season but given Looney’s potential to improve this might be dead even in the coming one.

Rest of the Bench for the 2 teams

It is the bench that is hardest to evaluate. Unlike last year’s bench, the 2014-15 bench was quite strong which spawned the Warrior logo “Strength in Numbers”. It included quality veteran players like Leandro Barbosa, David Lee, Mareese Sprouts and Shaun Livingston, who was playing at a much higher level than last season. The four of these together averaged over 26 points per game.  This coming year’s bench is much younger and more athletic. It includes Alec Burks, Glenn Robinson, Alfonzo McKinnie and Omari Spellman, plus several rookies and Jacob Evans III. The first four are all capable of scoring and are solid 3-point shooters (they could increase to well above average once with the Warriors). I expect that group, coupled with one or two of the others, to exceed the 2014-15 bench in defense…but may not have as much scoring fire power. The team is likely to give one or two of the rookies as well as Evans opportunities to earn minutes as well. The bench is an improvement over last year but may not be as strong as the 2014-15 squads.

Overall Assessment

I believe the 2019-2020 squad is better than the championship team of 2015. The starting lineup features the core 3 players who have improved since then, D’Angelo Russell who was an all-star last year, and a solid center in Willie Cauley-Stein making the edge substantial. Looney as 6th man is already giving evidence of future stardom. While he was not quite the Andre Iguodala of 2014-15, the difference is modest, and Looney continues to improve. The 2014-15 bench appears superior to that of next season, but the edge is not great as the newer group should be stronger defensively and is not far off the older group as scorers – the question will be how well they gel and how much the Curry/Klay factor improves their scoring. Finally, I think Kerr is a better coach today than he was given the last 5 years of experience.

They May Have Improved vs 2014-15, but so has the Competition

ESPN and CBS power rankings reflect the fact that multiple teams have created new “super star” two-somes:

  • Lakers: Lebron and Anthony Davis
  • Clippers: Kawhi Leonard and Paul George
  • Houston: Harden and Westbrook (in place of Chris Paul)
  • Nets: Kyrie Irving and Durant

Contenders also include improving young teams like Boston, Philadelphia, Denver, and Utah plus an improved Portland squad. This makes the landscape much tougher than when the Warriors won their 2015 championship. Yet, none of these teams seem better than the Cleveland team (led by a younger LeBron, Kyrie Irving and Kevin Love) the Warriors beat in 2015. So, assuming Klay returns by late February and is back to par, I believe the Warriors will remain strong contenders given the starting team with four all-stars augmented by Willie Cauley-Stein and an improving Kevon Looney as 6th man. However, it will be much tougher going in the early rounds in the playoffs, making getting to the finals longer odds than in each of the past 5 years.

SoundBytes

  1. An examination of Table 2 reveals several interesting facts:
  2. Curry, once again is the leader among top scorers in effective shooting and the only one over 60%
  3. Antetokounmpo is only slightly behind despite being a very poor 3-point shooter. If he can improve his distance shooting, he may become unstoppable
  4. Russell Westbrook, once again, had the worst effective shooting percent of anyone who averaged 20 points or more. In fact, he was significantly below the league average. Part of the reason is despite being a very poor 3-point shooter he continues to take too many distance shots. Whereas most players find that taking 3s increases their effective shooting percent, for Westbrook it lowers it. I haven’t been able to check this, but one broadcaster stated that he has the lowest 3-point percentage of any player in history that has taken over 2500 3-point shots!
  5. I believe that Westbrook has a diminished chance to accumulate as many triple doubles next season as he has in the past. There is only one ball and both he and Harden tend to hold it most of the time. When Chris Paul came to the Rockets his assists per game decreased by about 15% compared to his prior 3 season average.

My Crazy Investment Technique for Solid Growth Stocks

You should not try it!

Applying Private Investment Analysis to the Rash of Mega-IPOs Occurring

The first half of 2019 saw a steady stream of technology IPOs. First Lyft, then Uber, then Zoom, all with different business models and revenue structures. As an early investor in technology companies, I spend a lot of time evaluating models for Venture Capital, but as a (recovering) investment analyst, I also like to take a view around how to structure a probability weighted investment once these companies have hit the public markets. The following post outlines a recent approach that I took to manage the volatility and return in these growth stocks.

Question: Which of the Recent technology IPOs Stands out as a Winning Business Model?

Investing in Lyft and Uber, post IPO, had little interest for me. On the positive side, Lyft revenue growth was 95% in Q1, 2019, but it had a negative contribution margin in 2018 and Q1 2019.  Uber’s growth was a much lower 20% in Q1, but it appears to have slightly better contribution margin than Lyft, possibly even as high as 5%. I expect Uber and Lyft to improve their contribution margin, but it is difficult to see either of them delivering a reasonable level of profitability in the near term as scaling revenue does not help profitability until contribution margin improves. Zoom Video, on the other hand, had contribution margin of roughly 25% coupled with over 100% revenue growth. It also seems on the verge of moving to profitability, especially if the company is willing to lower its growth target a bit.

Zoom has a Strong Combination of Winning Attributes

There is certainly risk in Zoom but based on the momentum we’re seeing in its usage (including an increasing number of startups who use Zoom for video pitches to Azure), the company looks to be in the midst of a multi-year escalation of revenue. Users have said that it is the easiest product to work with and I believe the quality of its video is best in class. The reasons for Zoom’s high growth include:

  1. Revenue retention of a cohort is currently 140% – meaning that the same set of customers (including those who churn) spend 40% more a year later. While this growth is probably not sustainable over the long term, its subscription model, based on plans that increase with usage, could keep the retention at over 100% for several years.
  2. It is very efficient in acquiring customers – with a payback period of 7 months, which is highly unusual for a SaaS software company. This is partly because of the viral nature of the product – the host of the Zoom call invites various people to participate (who may not be previous Zoom users). When you participate, you download Zoom software and are now in their network at no cost to Zoom. They then offer you a free service while attempting to upgrade you to paid.
  3. Gross Margins (GMs) are Software GMs – about 82% and increasing, making the long-term model likely to be quite profitable
  4. Currently the product has the reputation of being best in class (see here) for a comparison to Webex.
  5. Zoom’s compression technology is well ahead of any competitor according to my friend Mark Leslie (a superb technologist and former CEO of Veritas).

The Fly in the Ointment: My Valuation Technique shows it to be Over Valued

My valuation technique, published in one of our blog posts, provides a method of valuing companies based on revenue growth and gross margin. It helps parse which sub-scale companies are likely to be good investments before they reach the revenue levels needed to achieve long term profitability. For Zoom Video, the method shows that it is currently ahead of itself on valuation, but if it grows close to 100% (in the January quarter it was up 108%) this year it will catch up to the valuation suggested by my method. What this means is that the revenue multiple of the company is likely to compress over time.

Forward Pricing: Constructing a Way of Winning Big on Appreciation of Even 10%

So instead of just buying the stock, I constructed a complex transaction on May 29. Using it, I only required the stock to appreciate 10% in 20 months for me to earn 140% on my investment. I essentially “pre-bought” the stock for January 2021 (or will have the stock called at a large profit). Here is what I did:

  1. Bought shares of stock at $76.92
  2. Sold the same number of shares of call options at $85 strike price for $19.84/share
  3. Sold the same number of shares of put options at $70 strike for $22.08/share
  4. Both sets of options expire in Jan 2021 (20 months)
  5. Net out of pocket was $35/share

Given the momentum I think there is a high probability (75% or so) that the revenue run rate in January 2021 (when options mature) will be over 2.5x where it was in Q1 2019. If that is the case, it seems unlikely that the stock would be at a lower price per share than the day I made the purchase despite a potential for substantial contraction of Price/Revenue.

In January 2021, when the options expire, I will either own the same shares, or double the number of shares or I will have had my shares “called” at $85/share.

The possibilities are: 

  • If the stock is $85 or more at the call date, the stock would be called, and my profit would be roughly 140% of the net $35 invested
  • If the stock is between $70 and $85, I would net $42 from the options expiring worthless plus or minus the change in value from my purchase price of $76.92. The gain would exceed 100%
  • If the stock is below $70, I’ll own 2x shares at an average price of $52.50/share – which should be a reasonably good price to be at 20 months out.
  •  Of course, the options can be repurchased, and new options sold during the time period resulting in different outcomes.

Break-Even Point for the Transaction Is a 32% Decline in Zoom Video Stock Price

Portfolio Managers that are “Value Oriented” will undoubtedly have a problem with this, but I view this transaction as the equivalent of a value stock purchase (of a high flyer) since the break-even of $52/share should be a great buy in January 2021. Part of my reasoning is the downside protection offered: where my being forced to honor the put option would mean that in January 2021, I would own twice the number of shares at an average price of $52.50/share. If I’m right about the likelihood of 150% revenue growth during the period, it would mean price/revenue had declined about 73% or more. Is there some flaw in my logic or are the premiums on the options so high that the risk reward appears to favor this transaction?

I started writing this before Zoom reported their April quarter earnings, which again showed over 100% revenue growth year/year. As a result, the stock jumped and was about $100/share. I decided to do a similar transaction where my upside is 130% of net dollars invested…but that’s a story for another day.

Estimating the “Probabilistic” Return Using My Performance Estimates

Because I was uncomfortable with the valuation, I created the transaction described above. I believe going almost 2 years out provides protection against volatility and lowers risk. This can apply to other companies that are expected to grow at a high rate. As to my guess at probabilities:

  1. 75% that revenue run rate is 2.5x January 2019 (base) quarter in the quarter ending in January 2021. A 60% compound annual growth (CAG) for 2 years puts the revenue higher (they grew over 100% in the January 2019 quarter to revenue of $105.8M)
  2. 95% that revenue run rate is over 2.0X the base 2 years later (options expire in January of that year). This requires revenue CAG of 42%. Given that the existing customer revenue retention rate averaged 140% last year, this appears highly likely.
  3. 99% that revenue is over 1.5X the base in the January 2021 quarter (requires slightly over 22% CAG)
  4. 1% that revenue is less than 1.5X

Assuming the above is true, I believe that when I did the initial transaction the probabilities for the stock were (they are better today due to a strong April quarter):

  1. 50% that the stock trades over 1.5X today by January 2021 (it is almost there today, but could hit a speed bump)
  2. 80% that the stock is over $85/share (up 10% from when I did the trade) in January 2021
  3. 10% that the stock is between $70 and $85/share in January 2021
  4. 5% that the stock is between $52 and $70 in January 2021
  5. 5% that the stock is below $52

Obviously, probabilities are guesses since they heavily depend on market sentiment, whereas my revenue estimates are more solid as they are based upon analysis, I’m more comfortable with. Putting the guesses on probability together this meant:

  1. 80% probability of 140% profit = 2.4X
  2. 10% probability of 100% profit = 2.0X
  3. 5% probability of 50% profit (this assumes the stock is in the middle at $61/share) = 1.5X
  4. 5% probability of a loss assuming I don’t roll the options and don’t buy them back early. At $35/share, loss would be 100% = (1.0X)

If I’m right on these estimates, then the weighted probability is 120% profit. I’ve been doing something similar with Amazon for almost 2 years and have had great results to date. I also did part of my DocuSign buy this way in early January. Since then, the stock is up 27% and my trade is ahead over 50%. Clearly if DocuSign (or Amazon or Zoom) stock runs I won’t make the same money as a straight stock purchase would yield given that I’m capped out on those DocuSign shares at slightly under 100% profit, but the trade also provides substantial downside protection.

Conclusion: Investing in Newly Minted IPOs of High Growth Companies with Solid Contribution Margins Can be Done in a “Value Oriented” Way  

When deciding whether to invest in a company that IPOs, first consider the business model:

  • Are they growing at a high rate of at least 30%?
  • Experiencing increasing contribution margins already at 20% or more?
  • Is there visibility to profitability without a landscape change?

Next, try to get the stock on the IPO if possible. If you can’t, is there a way of pseudo buying it at a lower price? The transaction I constructed may be to complex for you to try and carries the additional risk that you might wind up owning twice the number of shares. If you decide to do it make sure you are comfortable with the potential future cash outlay.

R&D: Amazon’s Dirty Little Secret Weapon


Why doesn’t Amazon produce more earnings given its dominance?

Amazon just reported earnings and, as was the case in 2017 and 2016, emphasized that 2019 will be an investment year, so the strong operating margin expansion of 2018 would be capped in 2019. This, of course, is great fodder for bears on the stock as Amazon gave sceptics renewed opportunity to point out that it is a company that has a flawed business model and would find it difficult to ever earn a reasonable return on revenue.

In contrast, I believe that Amazon continues to transform itself into a potential strong profit performer. For example, taking the longer perspective, Amazon’s gross margins are now over 40% up from 27.2% five years ago (2013). So why doesn’t Amazon deliver higher operating margin than the slightly over 6% it reported in 2018? Amazon’s dirty little secret is that it continues to invest heavily in creating future dominance through R&D. Had it spent a similar amount in R&D to its long time competitor, Walmart, EBITDA would have nearly tripled… to over 17% of revenue! I must confess that in the past I haven’t paid enough attention to how much Amazon spends on R&D. As a result, I was surprised that Apple and Microsoft trailed it in voice recognition technology and that Amazon could lead IBM and Microsoft in cloud technology. The reason this occurred is not a surprising one: Amazon outspends Apple, Microsoft and IBM in R&D.

In fact, Amazon now outspends every company in the world (see Table 1) and have been dedicating a larger portion of available dollars to R&D (as measured by the % of gross margin dollars spent on R&D) than any other large technology company, except Qualcomm, for more than 10 years. Even though Amazon had less than 50% of Apple’s revenue and less than 1/3 of its gross margin dollars 5 years ago (2013) Amazon spent nearly 50% more than Apple on R&D that year… by 2018 the gap had increased to close to 100% more.

Table 1: Top 10 (and a few more) U.S. R&D Spenders in 2018 ($Bn)

Sources: market watch, analyst reports, annual filings

Note 1: Ford and GM may be in the top 10 but so far have not reported R&D in 2018. If they report it at year end the table could change. Walmart does not report R&D and their spend is generally unavailable, but I found a reference that said they expected to spend $1.1M in 2017.

Note 2: A 2018 global list would include auto makers VW and Toyota (with R&D of $15.8B and about 10.0B), drug company Roche (&10.8B) and tech company Samsung at $15.3B in place of the lowest 4 in Table 1.

The Innovators Financial Dilemma: Increasing Future Prospects can lower Current Earnings

When I was on Wall Street covering Microsoft (and others) Bill Gates would often point out that the company was going to make large investments the following year so they could stay ahead of competition. He said he was less concerned with what that meant for earnings. That investment helped drive Microsoft to dominance by the late 1990s. Companies are often confronted with the dilemma of whether to increase spending to drive future growth or to maximize current earnings. I believe that investment in R&D, when effective, is correlated to future success.

It is interesting to see how leaders in R&D spending have transitioned over the past 10 years. In 2008 the global leaders in R&D spending included 5 pharma companies, 3 auto makers and only 2 tech companies (Nokia and Microsoft which subsequently merged). In 2018, 6 of the top 7 spenders (Samsung plus the 5 shown in Table 1) were technology companies.

Table 2 – 2008 global R&D leaders ($Bn)

Note: *Facebook data from 2009, first available financials from S-1 filing

It’s hard to change without tanking one’s stock

When a company has a business model that allocates 1% of gross margin dollars to R&D, it is not easy to turn on the dime. If Walmart had decided to invest half as much as Amazon in R&D in 2018, its earnings would have decreased by 80% – 90% and its stock would have depreciated substantially. So, instead it began a buying binge several years ago to try to close the technology gap through acquisitions (which has a much smaller impact on operating margins). It remains to be seen if this strategy will succeed going forward but in the past 5 years Walmart revenue (including acquisitions) increased only 5% while Amazon’s was up 130% in the same period (also including acquisitions).

Whatever Happened to IBM?

When I was growing up, I thought of IBM as the king of tech. In the early 1990s it still seemed to rule the roost. The biggest fear for Microsoft was that IBM could overwhelm it, yet now it appears to be an also ran in technology. From 2014 to 2018, a heyday era for tech companies, its revenue shrank from $93 billion in 2014 to $80 billion in 2018. I can’t tell how much of the problem stems from under investing in R&D versus poor execution, but for the past 5 years it has spent an average of about 13% of GM on R&D, while the 6 tech companies in Table 1 have averaged about 24% of GM dollars with Apple the only one under 20%.


Soundbytes

Soundbyte I: Tesla

  • I recently had a long dialogue with a very smart fund manager and was struck by what I believe to be misinformation he had read regarding Tesla. There were 3 major points that he had heard:
    • The quality of Tesla cars was shoddy
    • Tesla could not maintain reasonable margins as it began producing lower priced Model 3s
    • The upcoming influx of electric cars from companies like Porsche, Jaguar and Audi would take substantial market share away from Tesla

I decided to do a bit of research to determine how valid each of these issues might be.

  • Tesla Quality: I found it hard to believe that the majority of Tesla owners thought the car was of poor quality since every one of the 15 or so people I knew who had bought one had already bought another or were planning to for their next car. So, I found a report on customer satisfaction from Consumer Reports, and I was not surprised to find that Tesla was the number 1 ranked car by customer satisfaction.
  • Tesla margins: this is much harder to predict. Since Tesla is relatively young as a manufacturer it has had numerous issues with production. Yet it is probably ahead of many others when it comes to automating its facilities. This tends to cause gross margins to be lower while volume ramps and higher subsequently. The combination of that, plus moving up the learning curve, should mean that Tesla lowers the cost of producing its products. However, Tesla charges more for cars with higher capacity for distance, but as I understand it uses software to limit battery capacity for lower priced cars. This would mean that a portion of the difference between a lower priced Model 3 and a higher priced one (the battery capacity) would be minimal change in cost, putting pressure on margins. The question becomes whether Tesla’s improving cost efficiencies offset the average price decline of a Model 3 as Tesla begins fulfilling demand for lower priced versions.
  • March 1 Update: After this post was complete (Thursday February 28) the company announced it was closing many showrooms to reduce costs. Then late today (Friday) announced that the $35,000 version of the model 3 is now available. So, we shall soon see the impact. I believe that if Tesla has increased capacity there will be very strong sales. It also likely will experience lower gross margin percentages as it climbs the learning curve and ramps production.
  • Will the influx of electric cars from others impact Tesla market share?


  1. Porsche is an electric sports car starting at $90K – at that price point it is competitive with model S not model 3. In competing with the S it comes down to whether one prefers a sports car to a sedan. I have owned a Porsche in the past and would only consider it if I wanted a sports car with limited seating capacity (but very cool). I loved my Porsche but decided to switch to sedans going forward. Since then I’ve owned only sedans for the past 10+ years. It also appears that early production is almost a year away, so it is unlikely to be competitive for 2019.
  2. Audi is at price points that do compete with the Model 3 and expects to start delivering cars in March. However, I think that is mainly in Europe where Tesla is an emerging brand so it might not impact them at all. When I look at the Audi models I don’t think they will appeal to Tesla buyers as they are very old-line designs (I would call them ugly). The range of the cars on a charge is not yet official but seems likely to be much lower than Tesla which has a big lead in battery technology.
  3. The Jaguar competes with the Tesla Model X but while cheaper, appears a weak competitor.


I don’t want to dismiss the fact that traditional players will be introducing a large number of electronic vehicles. The question really is whether the market size for electric cars is a fixed portion of all cars or whether it will become a much larger part of the entire market over time. I would compare this to fears that analysts had when Lotus and Wordperfect created Windows versions. They felt that Microsoft would lose share of windows spreadsheets and word processors. I agreed but pointed out that Windows was 10% of the entire market for spreadsheets, so having a 90% share gave Microsoft 9% of the overall spreadsheet market. I also predicted Microsoft would have over a 45% share when Windows was 100% of the market. So, while this would decrease Microsoft’s share of Windows spreadsheets, it would grow its total share of the market by 5X Of course we all were proven wrong as Microsoft eventually reached over 90% of the entire market.

For Tesla, the question becomes whether these rivals are helping accelerate the share electric cars will have of the overall market, rather than eroding Tesla volumes. I’m thinking that it’s the former, and that Tesla will have a great volume year in 2019 and that its biggest competitive issue will be whether the Model 3 is so strong that it will get people to buy it over the Model S. Of course, I could be wrong, but believe the odds favor Tesla in 2019, especially the first half of the year where the competitors are not that strong.

Soundbyte II: The NYC / Amazon Deal Collapses

I never cease to be amazed at how little regard some Politicians have for facts. I should likely not have been surprised by the furor created over Amazon locating a major facility in New York City. I thought the $44 billion or more in benefits to the City and State and massive job creation were such a win that no one would contest it. Instead, the dialog centered around the $ 3 billion in tax benefits to Amazon. All but 1/6 of the benefits (which was cash from the state) were based on existing laws and amounted to a reduction of future taxes rather than upfront cash. What a loss for the City.